You are logged in as:

This is a Members-Only Content

How to Improve Your
Sales Forecasting With AI?

Author: Christian Martinez, December 2023

What will you learn:

1) The different types of forecasting techniques (table below)
2) Which techniques use AI
3) Focus on one technique that you can use: Prophet
4) How to use Prophet
5) Get our code to run this model yourself
 

Introduction

Sales forecasting is crucial for long-term business growth, but it’s often imprecise and consumes a lot of time.

A Forbes survey found that 74% of large B2B companies ($10B+ annual sales) do weekly forecasting, yet 69% of all B2B companies, regardless of size, find their forecasting efforts ineffective.

That’s quite a bit of inefficiency, isn’t it?

McKinsey’s research in 2022 highlighted the superiority of AI models compared to traditional spreadsheet-based analytics.

For example, in supply chain operations (the area in which I have been working for 8 years); when AI-driven forecasting is applied; it can lead to significant benefits, including a 20% to 50% reduction in errors and a potential decrease in up to 65% in lost sales and product unavailability.

Now AI is everywhere, and is cheaper than ever to implement it.

You as a CFOs or a Finance Leader should consider the potential advantages of adopting these AI-driven approaches in their forecasting routines for improved efficiency and outcomes.

How Can We Apply AI to This?

Choosing the right model for you is hard especially when balancing the need for accuracy with the practicalities of implementation.

From traditional methods relying on historical data to advanced AI-driven approaches, you can explore a spectrum of tools designed to cater to various industries and business scales.

We aim to demystify these complex models, translating them into actionable insights for you, a busy financial professional.

This table below serves as your compass in navigating the diverse landscape of sales forecasting techniques.

You can also download the original PDF version of the table (easier for readability and further use).

LEVELMODELDESCRIPTIONADVANTAGESDISADVANTAGESUSE CASESSUITABLE INDUSTRYTOOL RECOMMENDED
N/AIntuitive ForecastingBased on human judgment and experience rather than formal analytical methods.– Flexible
– Can incorporate non-quantifiable factors
– Quick to implement
– Subjective
– Potentially less accurate
– Not scalable
Short-term forecasts, in industries with high levels of uncertainty, when data is scarce, and you have experienced sales team.Startup BusinessesSalespeople’s educated guesses
BasicRun Rate AnalysisExtrapolates future performance from historical data, assuming current conditions continue.– Simple to calculate
– Useful for stable conditions
– Requires minimal data
– Assumes constant conditions
– Ignores market changes
– Potentially inaccurate in dynamic environments
Basic forecasting for stable industries, quick estimation of future sales, budget planning.ManufacturingMicrosoft Excel
BasicLinear RegressionModels a linear relationship between inputs and a continuous numerical output variable.– Simple and explainable
– Fast training,
– Explainable
– Assumes linear relationships
– Sensitive to outliers
– Potential underfitting in complex scenarios
Trend analysis, volume prediction, revenue forecasting for new products.Real EstateMicrosoft Excel, Alteryx or Python
IntermediateLogarithmic RegressionUses logarithmic transformation to model relationships.– Good for modelling diminishing effects
– Effective in certain nonlinear scenarios
– Assumes specific type of relationship
– Less effective for short-term forecasts
– Requires understanding of logarithmic relationships
Situations with diminishing returns, long-term forecasting, market saturation analysis.Consumer Packaged Goods (CPG)Alteryx or Python
IntermediateTime Series Analysis (ARIMA, SARIMA)Statistical methods for analysing time series data.– Captures seasonality and trends
– Effective for short-term forecasting
– Adjusts to changing trends over time.
– Requires stationary data, complex to configure
– Not suitable for all types of sales data
Seasonal sales forecasting, demand forecasting for perishable goods, long-term sales planning.RetailAlteryx or Python
AdvancedRandom ForestAn ensemble learning method for regression using multiple decision trees.-Handles non-linear data
– Robust to outliers
– Captures complex relationships.
– Computationally intensive
– Less interpretable
– Potential overfitting with noisy data.
Sales prediction in diverse categories, across multiple stores/regions, with live dataE-commercePython or Microsoft Azure
AdvancedNeural Networks (Deep Learning)Advanced algorithms modeling high-level abstractions in data.– High performance with large datasets
– Good for complex non-linear relationship
– Adaptable to new patterns.
– Requires large data
– You need advanced data science skills
High-volume, high-dimensional sales data, forecasting in rapidly changing markets, integrating diverse data sources.TechnologyPython or Microsoft Azure
AdvancedProphet (by Facebook)A forecasting tool designed for business applications with seasonal patterns.– Handles holiday effects well
– Robust to missing data
– Intuitive for business
– Less effective with non-seasonal data
– Moderate complexity
Forecasting seasonal sales, understanding holiday effects, planning inventory.Tourism and HospitalityPython

Sales Forecasting Decision Tree

Which Algorithm Should I Use for My Data?

Think of this table as a map to understand the possibilities that artificial intelligence brings to the table. But, how to decide which one to use in a very quick and efficient way?

We have created this decision tree for you:

Focus on The Prophet and How to Use it

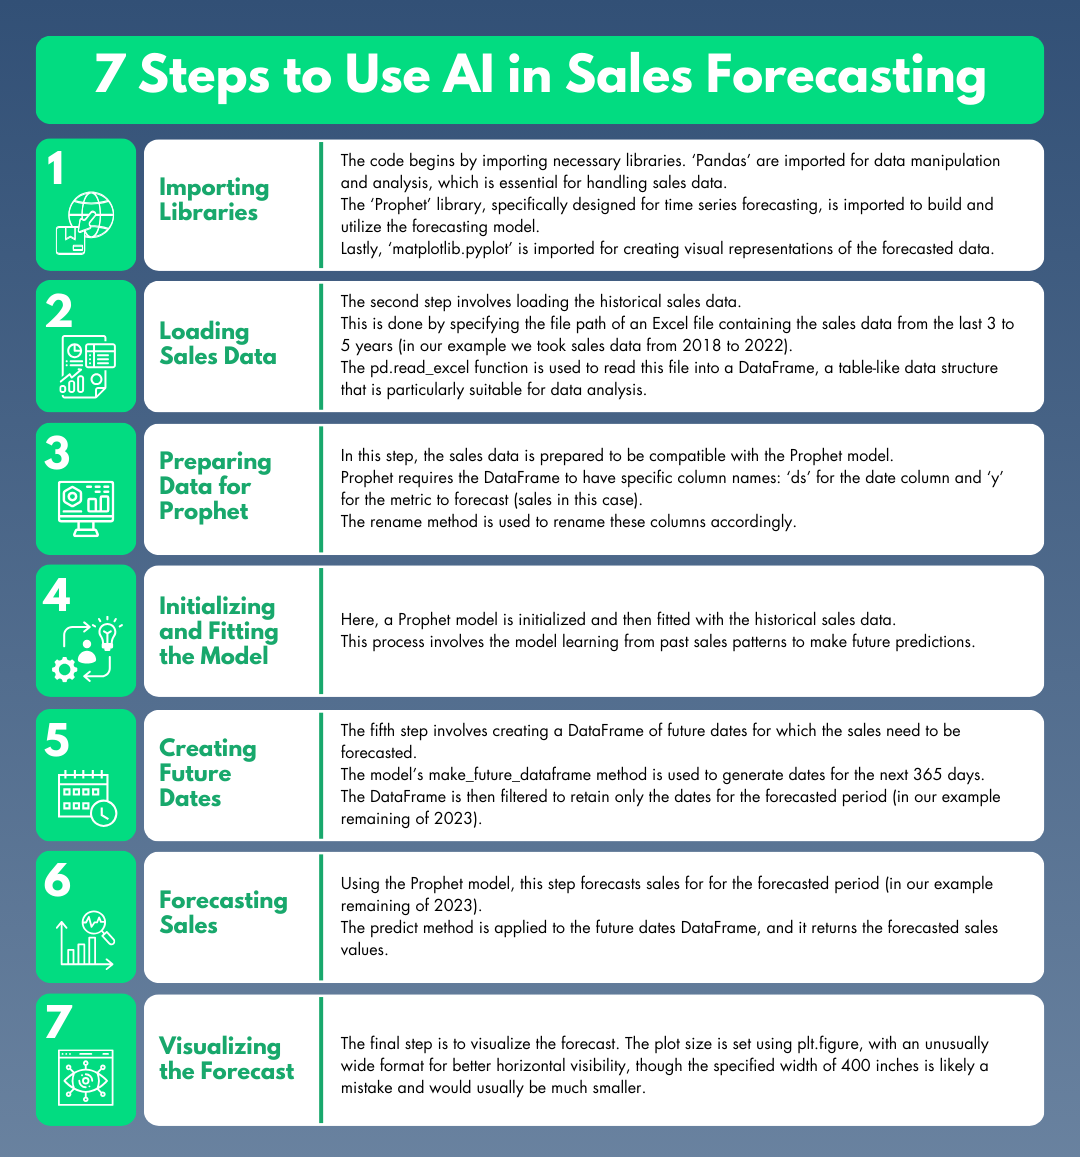
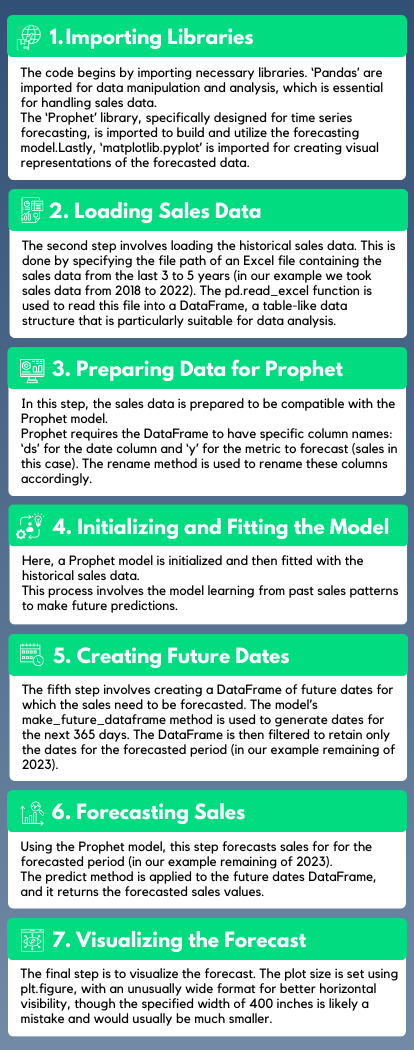
Now I want to show you how to implement one of my favorite AI advanced Models: Prophet.

What Is Prophet?

It is an open-source algorithm developed by Facebook for time series forecasting.

Think about this AI tool/algorithm like a sophisticated calendar that helps predict sales by considering special events, holidays, and other patterns that happen over time.

Prophet is particularly effective for business forecasts with daily observations that display patterns on different time scales, such as weekly and yearly, as well as holidays and other recurring events.

We like Prophet because it is user-friendly, even for those with limited experience in time series analysis whilst still being reliable. Moreover, it automates many of the tricky parts of time series forecasting, like trend detection and seasonality decomposition.

If your sales data have gaps or missing values, Prophet can handle these effectively. On the flip side, be aware that sales can be influenced by a wide range of factors not captured in historical data (e.g., market trends, competitive actions, economic changes).

Prophet, like any algorithm, can’t account for these if they’re not in the data. Remember, trash in, trash out!

The accuracy of any forecasting model, including this one, is highly dependent on the quality of the input data. Poor quality or insufficient data can lead to inaccurate forecasts.

Want to Get Technical?

In more technical terms, Prophet operates on an additive model where non-linear trends are fit with daily, weekly, and yearly seasonality, plus holiday effects. The model decomposes a time series into three main components: trend, seasonality, and holidays.

Prophet employs a Bayesian framework for parameter estimation, using Markov Chain Monte Carlo (MCMC) methods which is a type of the famous “Monte Carlo Simulations” used in finance. This statistical approach allows for the automatic handling of outliers and missing data, and the additive nature of the model components makes it interpretable and adaptable to many different types of time series data.

How to Apply Prophet to My Data?

For this, you will need Python.

Note: If you don’t know yet how to use Python, we (Nicolas & Christian) have taught 100 finance professionals how to use Python in our Advanced ChatGPT for Finance course. Reach out to us if you want to know more.

Here is the code (feel free to steal it!)
(You can also download the Google Colab Notebook and reuse it for yourself)

# Step 1: Importing Libraries

import pandas as pd from prophet import Prophet

import matplotlib.pyplot as plt from openpyxl

import Workbook from openpyxl.drawing.image

import Image

# Step 2: Loading Sales Data

file_path = ‘/content/sales_data_2018_to_2022.xlsx’ # Replace with your file path
sales_data = pd.read_excel(file_path)

# Step 3: Preparing Data for Prophet

sales_data.rename(columns={‘Date’: ‘ds’, ‘Sales’: ‘y’}, inplace=True)

# Step 4: Initializing and Fitting the Model

model = Prophet()
model.fit(sales_data)

# Step 5: Creating Future Dates for Prediction

future_dates = model.make_future_dataframe(periods=365)
future_dates = future_dates[future_dates[‘ds’].dt.year == 2023]

# Step 6: Forecast sales for 2023

forecast = model.predict(future_dates)

# Step 7: Visualize and Save the Forecast

fig = model.plot(forecast, xlabel=’Date’, ylabel=’Sales’)
plt.title(‘Sales Forecast for 2023 using Prophet’)

# Save the plot as an image BEFORE calling show

plt.savefig(‘forecast_plot.png’)

# Now display the plot

plt.show()

# Insert the Image into an Excel File

wb = Workbook()
ws = wb.active

# Ensure the path is correct when loading the image

img = Image(‘forecast_plot.png’)
ws.add_image(img)

# Save the workbook with the image

wb.save(‘forecast_in_excel.xlsx’)

7 Steps to Use AI in Sales Forecasting

We have made comments in the code so you can use it straight away with your data but also, we will explain each step of the process on how to apply Prophet below.

Here is a detailed explanation of each of the steps of the process:

Visualization

In the code, the model.plot method is used to create the forecast plot, labeling the axes for clarity. A title is added to the plot for context, and plt.show() displays the final visualization.

There is also the last bit of the code that saves the image directly in Excel for you!

How to read the graph below?

In this visual, the historical sales data is used by the Prophet model to understand the pattern in the sales over time. The model then uses this understanding to forecast future sales.

A graph showing the sales forecasting using the Prophet model.

Each black dot represents an actual observed data point. These are the historical sales data points from 2018 to the end of 2022.

The dark blue line in the graph shows the predicted central trend of sales according to the model.

The light blue shading represents the uncertainty interval of the forecast. It shows the range within which the actual values are expected to fall with a certain probability.

The lighter the blue, the lower the probability, hence it’s wider to express greater uncertainty further out into the future.

Typically, Prophet provides a default 80% or 95% confidence interval for its forecasts.

Want to Learn More About Other Algorithms?

If you want to learn more about other algorithms like random forest or linear regression, here are two articles that describe how to use these algorithms for forecasting in finance:

BONUS: How to Export This Data to Excel?

One of the main questions I always get is: How to export this to Excel?

Gif on how to export your data to Excel.

Therefore, we have also included this feature at the bottom of the Python code.

You just need to install this extra library and run the code below.

				
					[ ] pip install openpyxl
Requirement already satisfied: openpyxl in /usr/local/lib/python3.10/dist-packages (3.1.2)
Requirement already satisfied: et-xmlfile in /usr/local/lib/python3.10/dist-packages (1.1.0)

[ ] # Save the forecast to an Excel file
forecast.to_excel('forecast_2023.xlsx', index=False)


STARTS IN:

— NEXT MASTERCLASS IS ON AUGUST 29TH —

3:00 PM - 4:30 PM (New York), 12:00 PM - 1:30 PM (Los Angeles), 9:00 PM - 10:30 PM (Berlin), 8:00 PM - 9:30 PM (London), 3:00 AM - 4:30 AM (next day, Singapore) 5:00 AM - 6:30 AM (next day, Sydney)

Forecasting & Budgeting with AI.

Join Zoom Meeting at the Scheduled Time:
https://us06web.zoom.us/j/87256403814?pwd=T1HbP3rOGNwzrtHtQItEtcjn2BRhUO.1

Meeting ID: 872 5640 3814
Passcode: 698936

___

*Your calendar invite has been sent to you. Please contact us if you haven’t received it.