A step-by-step guide drawn from the “Blueprints & Budgets: The Fractional CFO and the AI Advantage” masterclass. It covers the case, the method, every prompt shown on screen, how seven teams answered the same brief, and what the host asked everyone to flag.
Host Christian Martinez, Finance Transformation Senior Manager, Kraft HeinzSource 63-minute recording and transcript of the live sessionTimestamps17:30 mark where something appears in the recording
00
The method in eight steps
The session gave teams one case, one workbook and about an hour to build and pitch a solution. The steps below are the sequence the session taught, plus the checks the strongest teams added. Each step says where in the recording it comes from.
Step
What you do
Seen at
1
Read the case and name the audience. Five quiet minutes. Work out who reads the output (a bank and a CEO) and what the bank tests (debt service coverage, debt to EBITDA).
7:00
2
Treat the workbook as raw client data. It is imperfect on purpose. Challenge assumptions, and write down every gap instead of waiting for answers.
14:00
3
Set up roles and pick one builder. One person shares the screen and drives the AI. Others lead, check and present.
19:30
4
Ask the AI to write the prompt. Upload the case and ask for a prompt that produces three distinct approaches.
17:30
5
Choose one approach and ask for the build prompt. Discuss the three options as a team, pick one, then ask the AI for the prompt that builds it.
18:00
6
Build, citing tabs and asking for a live model. Name the tabs in the prompt. Ask for outputs that recalculate when an assumption changes.
31:3040:30
7
Audit and reconcile. Check the data against itself and against history, test the covenants, run a downside case and make Excel the master source for every number.
50:0057:0060:00
8
Present in two minutes. Show the result, then flag the assumptions you made, why you made them and what you would confirm with the client.
15:0054:30
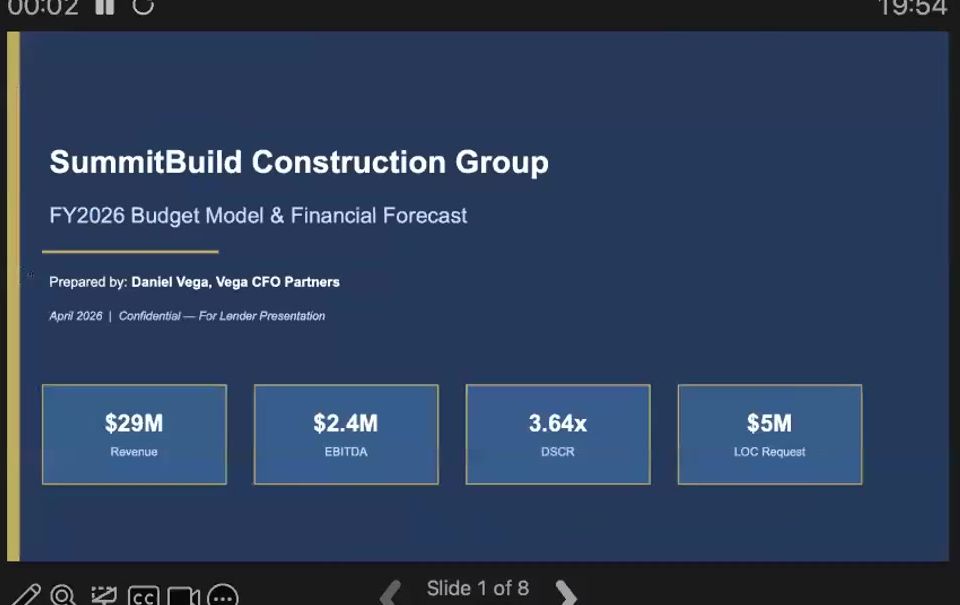
The session. Opening slide. 1:0501
The case
The case is fictional but built to look like a real engagement. You play Daniel Vega, a fractional CFO, and your client is SummitBuild Construction Group (SCG), a Denver commercial construction firm.
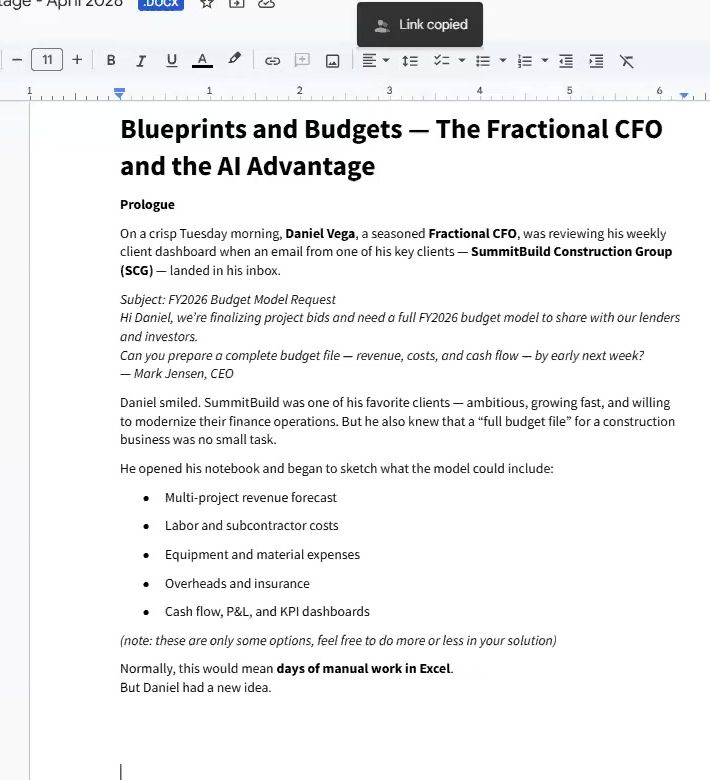
Hi Daniel, we’re finalizing project bids and need a full FY2026 budget model to share with our lenders and investors. Can you prepare a complete budget file — revenue, costs, and cash flow — by early next week?
Mark Jensen, CEO, in the case brief 7:15
The brief lists what the model could include: a multi-project revenue forecast, labor and subcontractor costs, equipment and material expenses, overheads and insurance, and cash flow, P&L and KPI dashboards. It adds that these are options, so you can do more or less. The setup line sets the tone: this would normally mean days of manual work in Excel, but Daniel had a new idea.
Case brief. The Word document the teams read for five minutes. 7:15
The workbook
The second input is an Excel workbook of twelve tabs. Its README says all figures are fictional but calibrated to realistic mid-market commercial construction benchmarks. FY2025 revenue is $25.0M and the company has 142 employees (85 field, 57 office and management).
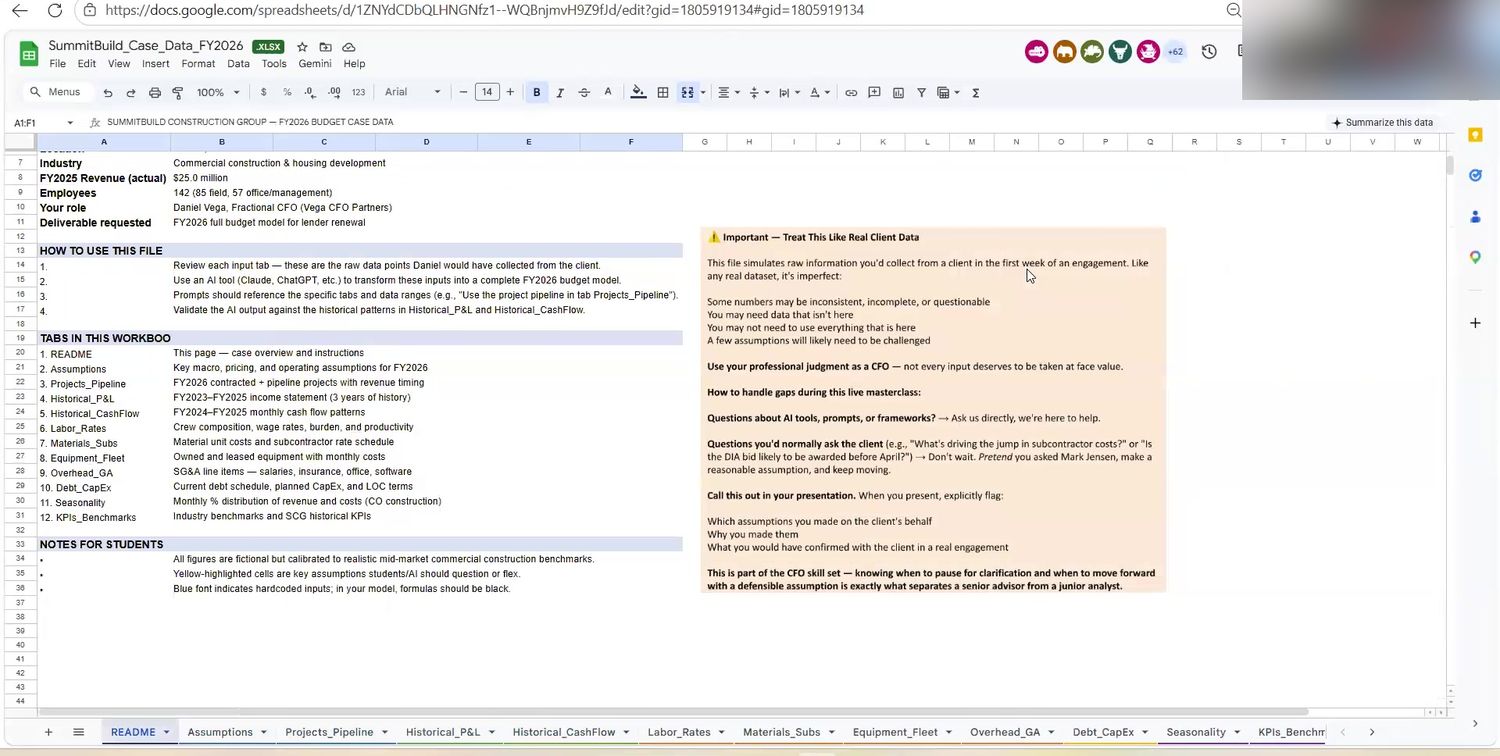
README tab. Case context on the left, the “Treat This Like Real Client Data” box on the right. 14:00
Tab
What it holds
README
Case overview and instructions
Assumptions
Key macro, pricing and operating assumptions for FY2026
Projects_Pipeline
FY2026 contracted and pipeline projects with revenue timing
Historical_P&L
FY2023 to FY2025 income statement
Historical_CashFlow
FY2024 to FY2025 monthly cash flow patterns
Labor_Rates
Crew composition, wage rates, burden and productivity
Materials_Subs
Material unit costs and subcontractor rate schedule
Equipment_Fleet
Owned and leased equipment with monthly costs
Overhead_GA
SG&A line items: salaries, insurance, office, software
Debt_CapEx
Current debt schedule, planned CapEx and line-of-credit terms
Seasonality
Monthly percentage distribution of revenue and costs for Colorado construction
KPIs_Benchmarks
Industry benchmarks and SCG historical KPIs
The numbers that matter
These figures come from the master prompt that one team’s AI wrote after reading the files, and from the dashboard it built (shown in section 04). They are the AI’s reading of the workbook, which this guide did not have, so confirm them against the source before relying on them.
Item
Value
Line of credit renewal, Mountain West Commercial Bank
$5M
Minimum DSCR (debt service coverage ratio)
1.25x
Maximum debt/EBITDA
3.0x (see note)
Projects in the pipeline
13
Gross pipeline value
$50.85M
Probability-weighted pipeline revenue
$40.3M
Contracted (signed) revenue
$31.05M
Direct labor base, escalation
$7.09M, 5.5%
Material inflation
2.8%
Days sales outstanding / days payable outstanding
58 / 42
Debt service, line-of-credit draw rate
$45.95K a month, 7.75%
CapEx plan
$733K
Target gross margin, effective tax rate
18.5%, 24.5%
Check this
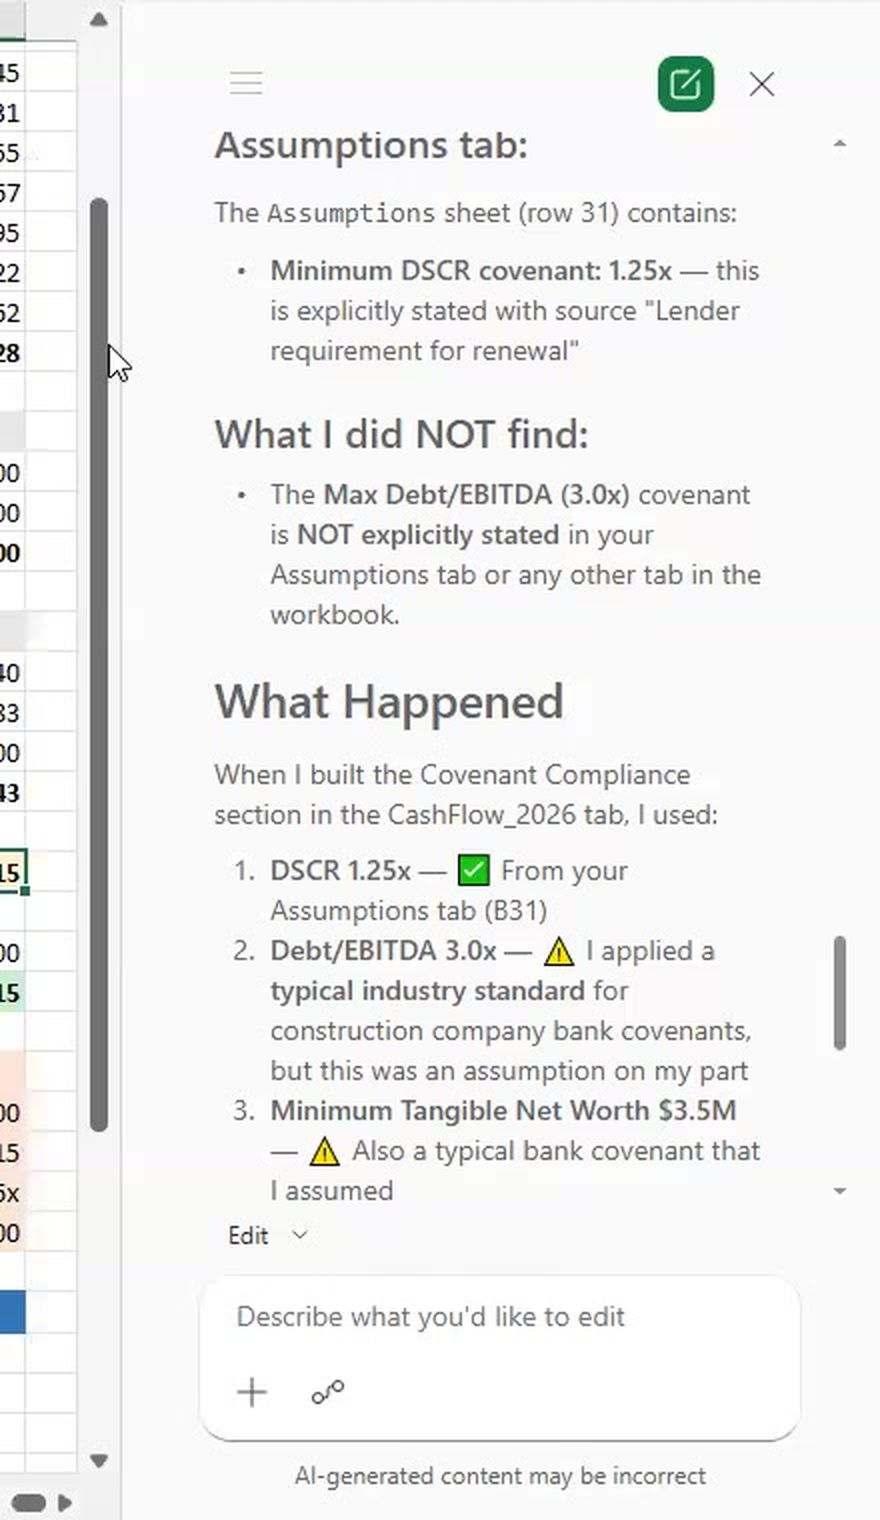
The 3.0x maximum debt/EBITDA appears in Claude’s master prompt. A team using Excel Copilot was told that figure is not explicitly stated anywhere in the workbook, and Copilot said it had applied a typical industry standard. The recording does not settle which is right, so look for the covenant in the source files before you build on it. 43:30
02
Ground rules for the data
The README opens with an orange box titled “Important — Treat This Like Real Client Data”. The host repeated its message aloud: the file simulates raw information collected from a client, so it may not be clean, and you should use professional judgment. 14:00
Some numbers may be inconsistent, incomplete, or questionable. You may need data that isn’t here. You may not need to use everything that is here. A few assumptions will likely need to be challenged.
Use your professional judgment as a CFO — not every input deserves to be taken at face value.
Case workbook, README tab
When you would normally ask the client
The README gives two example questions: what is driving the jump in subcontractor costs, and whether a particular airport bid is likely to be awarded before April. The rule is to not wait. Pretend you asked the CEO, make a reasonable assumption and keep moving. The host said the same thing to the room: if you disagree with an assumption, do not stop, but call it out in your presentation. 15:00
The README sets out exactly what to flag when you present.
Flag
What to say
Which assumptions
The assumptions you made on the client’s behalf
Why
Why you made each one
What to confirm
What you would have confirmed with the client in a real engagement
The README closes this box with the point of the exercise: knowing when to pause for clarification and when to move forward with a defensible assumption is what separates a senior advisor from a junior analyst.
How to use the workbook with AI
The README lists four instructions:
Review each input tab. They are the raw data points Daniel would have collected from the client.
Use an AI tool (Claude, ChatGPT and so on) to turn the inputs into a complete FY2026 budget model.
Reference the specific tabs and ranges in your prompts, for example “Use the project pipeline in tab Projects_Pipeline”.
Validate the AI output against the historical patterns in Historical_P&L and Historical_CashFlow.
Two formatting conventions help you read the file. Yellow-highlighted cells are key assumptions to question or flex, and blue font marks hardcoded inputs.
03
Run it as a team exercise
If you want to repeat the session with your own team, this is the format. Teams of three to five work together, and a typical session ran like this.
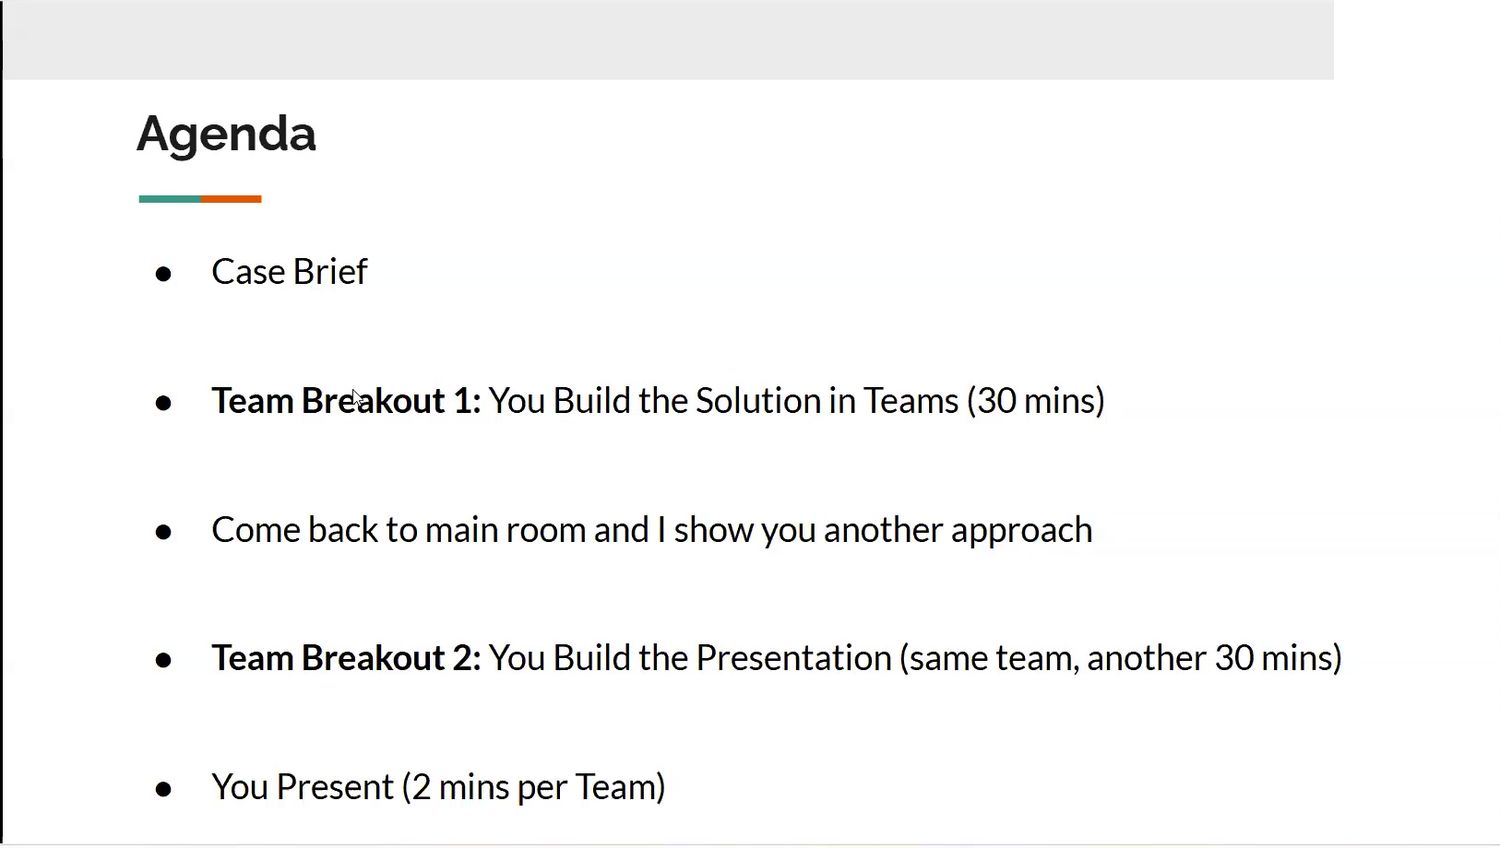
Agenda.5:30
Block
Time
What happens
Welcome
5 min
Everyone reports how many masterclasses they have done (1, 2 to 5, or more than 5) and renames themselves with a level prefix.
Case brief
5 min
Silent reading of the case document and workbook.
Approach tips
5 min
The host shows two ways to start (see section 04) and explains team roles.
Breakout 1
30 min
Teams build the solution. Not in the recording.
Main room
about 7 min
The host shows his own build and answers questions.
Breakout 2
30 min
The same teams build the presentation. Not in the recording.
Presentations
2 min a team
Each team shares its screen and pitches.
Levels, teams and roles
Levels. People prefix their display name with 1 (beginner), 2 (intermediate) or 3 (advanced), so the host can mix levels in each team instead of putting all beginners together. The host described intermediate as someone who already pays for an AI tool and uses it to generate Python for analysis, or who builds artifacts and skills in Claude. 2:00
Roles. Assign them at the start of the breakout: who presents, who leads, and who is the main AI builder sharing their screen. Teams also choose a name and introduce themselves. 19:30
Tools. Any tool is allowed: Claude, ChatGPT, Copilot or Gemini. If someone has only a free plan, the host advised that they not be the AI builder, because free tiers limit how far an analysis can go.
Judging. The host said the room would see who found the data discrepancies and who presented the best solution.
Team formation. Three to five people, a team name, and roles from the start. 19:3004
Choose your approach
Before any building, the host offered two ways to start. He called the second one “slightly better”.
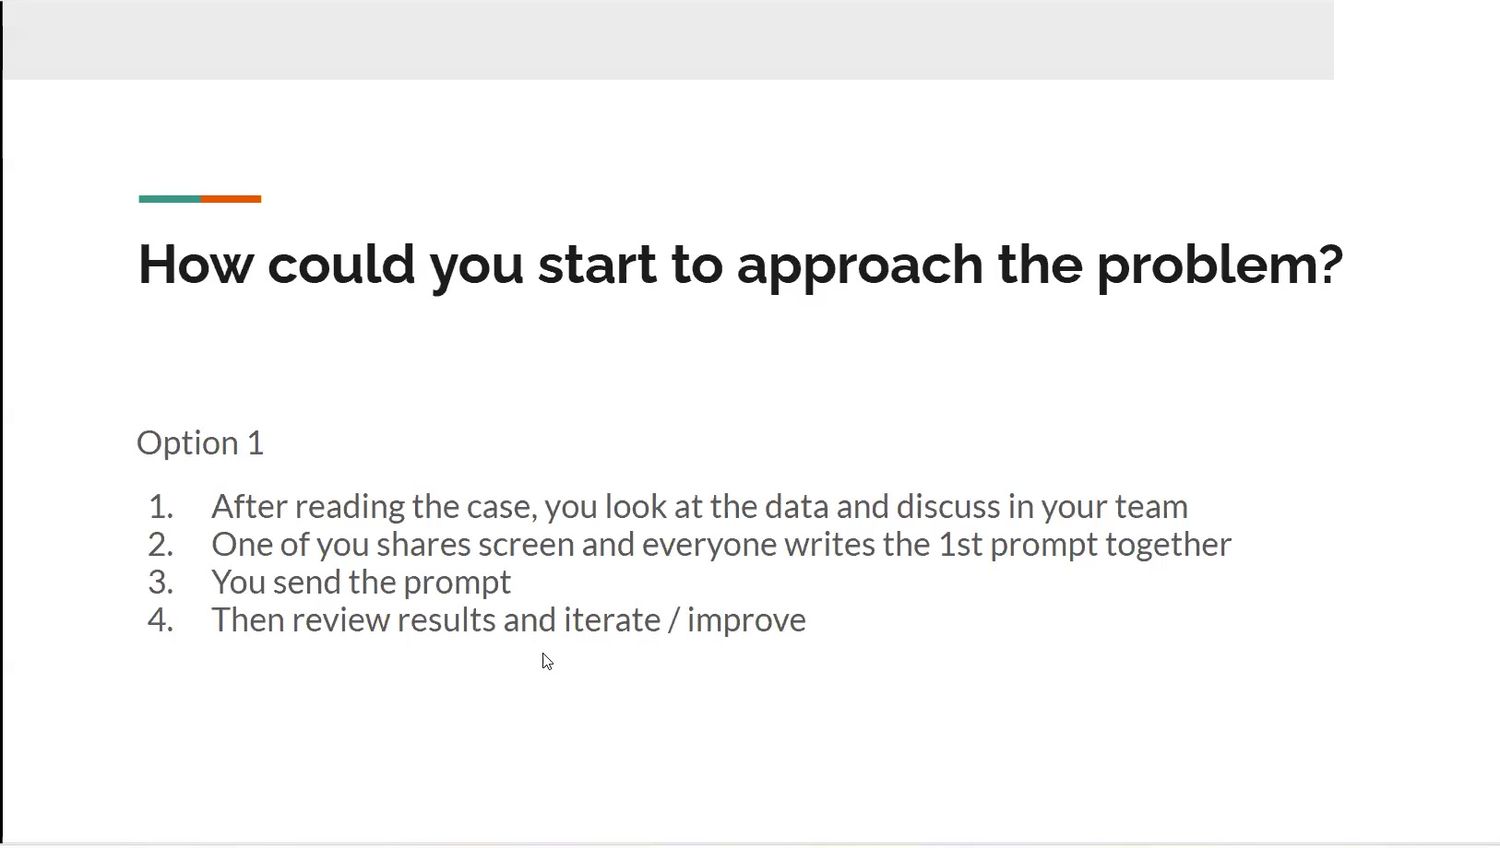
Option 1. Write the first prompt together and iterate. 16:45
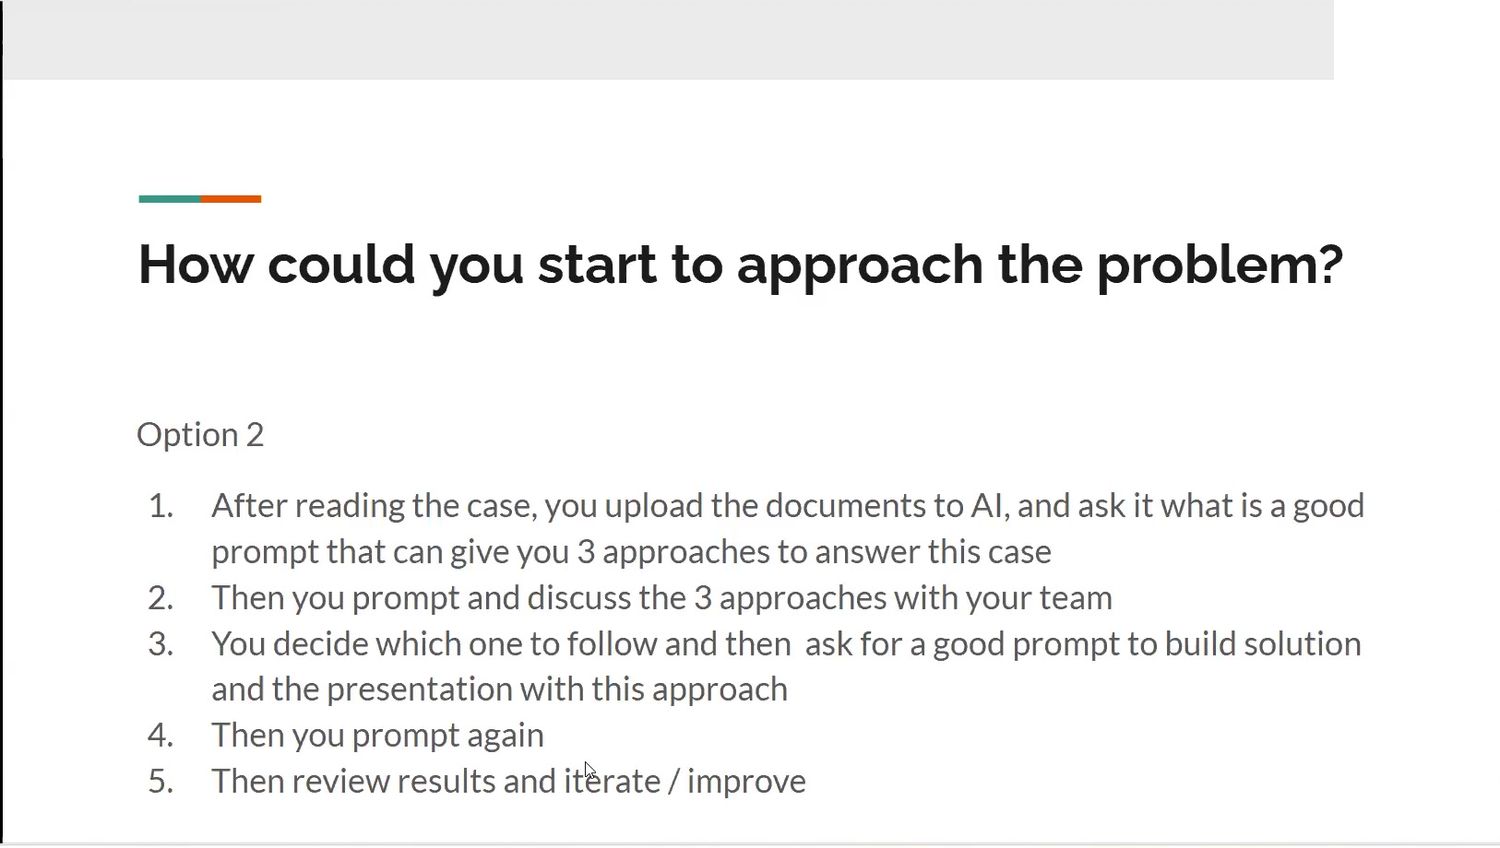
Option 2. Ask the AI to prompt for you. 18:00
Option 2, step by step
Upload the case document and the workbook to any of the main AI tools.
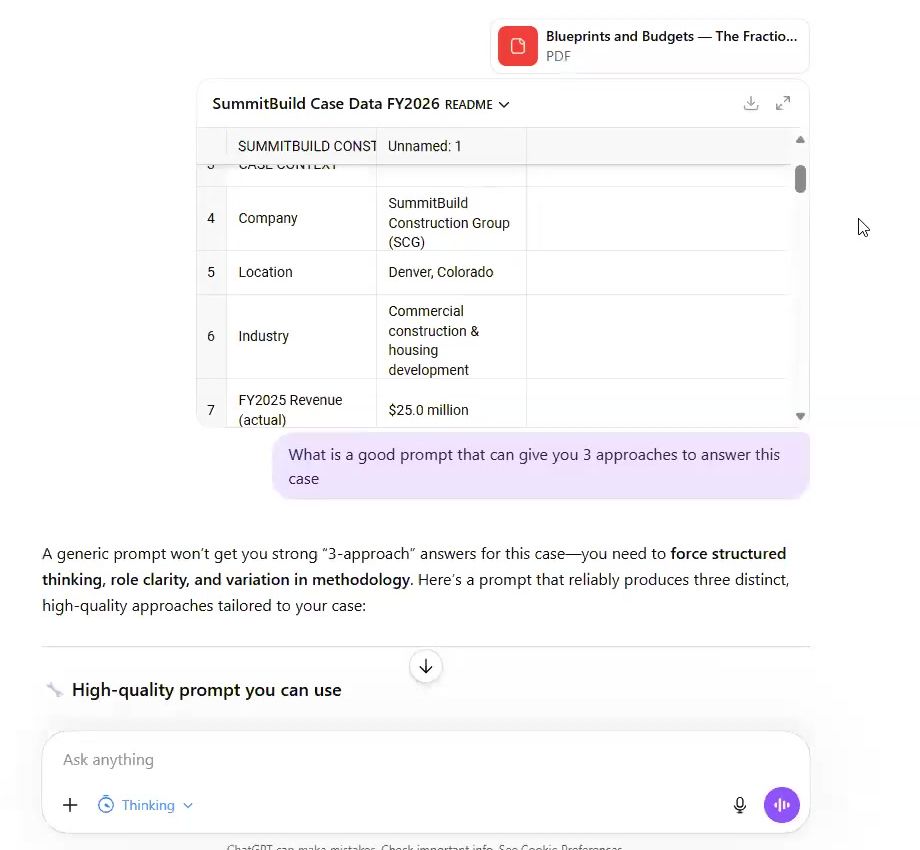
Ask for a prompt, not an answer. The host typed: “What is a good prompt that can give you 3 approaches to answer this case”. 17:25
Copy the prompt it writes and send it back with the same files attached. You should get three approaches.
Discuss the three approaches with your team and choose one. Time pressure is a legitimate reason to choose.
Ask the AI for the prompt that builds that approach, including the presentation, then send it.
Review the result, iterate and improve.
The host’s summary: you do not prompt, you ask the AI to prompt for you. 17:00
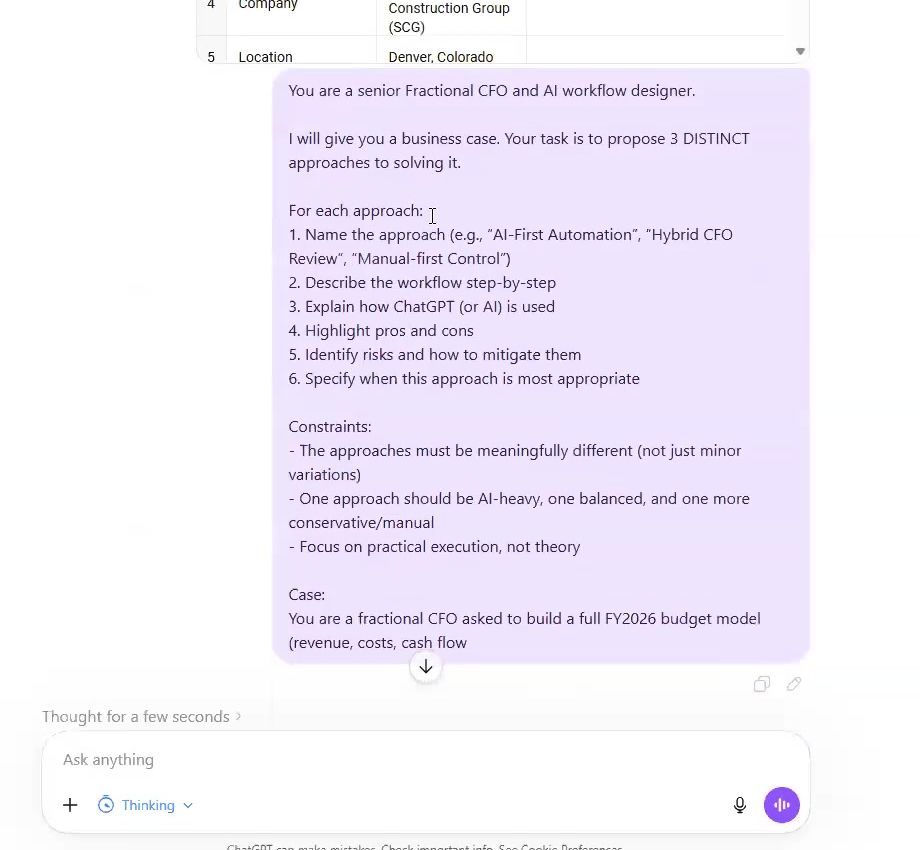
Step 2. The question, with the case workbook attached.
Step 3. The generated prompt, sent back as a message. 17:30
ChatGPT’s reply to step 2 explains why this works: a generic prompt will not give you strong three-approach answers, so you need to force structured thinking, role clarity and variation in methodology.
The three-approach prompt
This is the prompt ChatGPT generated, as it appears on screen. The text after “Case:” is cut off in the recording, so attach your case files or paste the brief where shown.
Prompt · ask for 3 approaches
You are a senior Fractional CFO and AI workflow designer.

I will give you a business case. Your task is to propose 3 DISTINCT approaches to solving it.

For each approach:
1. Name the approach (e.g., "AI-First Automation", "Hybrid CFO Review", "Manual-first Control")
2. Describe the workflow step-by-step
3. Explain how ChatGPT (or AI) is used
4. Highlight pros and cons
5. Identify risks and how to mitigate them
6. Specify when this approach is most appropriate

Constraints:
- The approaches must be meaningfully different (not just minor variations)
- One approach should be AI-heavy, one balanced, and one more conservative/manual
- Focus on practical execution, not theory

Case:
[Attach your case files, or paste: "You are a fractional CFO asked to build a full FY2026 budget model (revenue, costs, cash flow ..." and the rest of your brief]
What Claude returned for one team
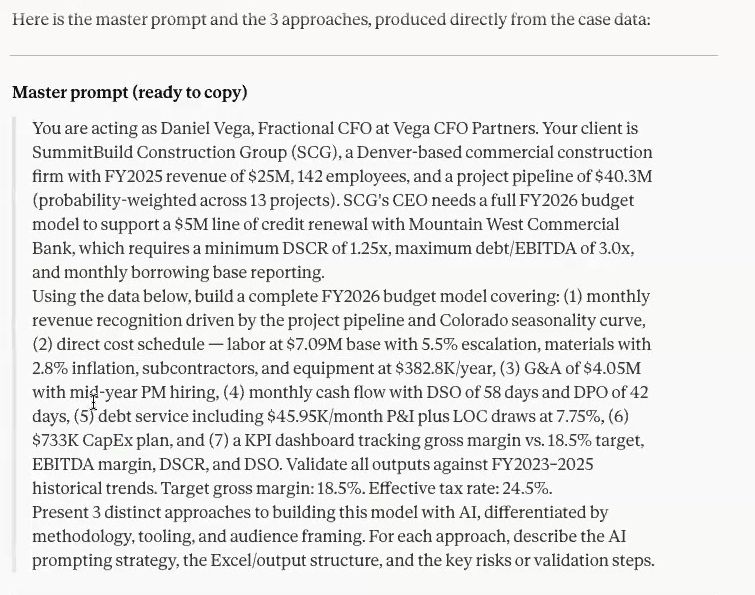
One team uploaded the Word brief and the workbook to Claude and asked for the best prompt. Claude returned a “master prompt (ready to copy)” and three approaches:
Lender-first, covenant-driven. Build the whole model backward from proving the bank’s covenants every quarter.
Project-by-project, bottom-up.
AI-native interactive dashboard.
The team chose the third “because of timing”. Claude’s own recommendation is not shown in the recording. 31:30
Claude’s master prompt. Written by Claude from the two uploaded files. 31:50
Prompt · master prompt Claude wrote
You are acting as Daniel Vega, Fractional CFO at Vega CFO Partners. Your client is SummitBuild Construction Group (SCG), a Denver-based commercial construction firm with FY2025 revenue of $25M, 142 employees, and a project pipeline of $40.3M (probability-weighted across 13 projects). SCG's CEO needs a full FY2026 budget model to support a $5M line of credit renewal with Mountain West Commercial Bank, which requires a minimum DSCR of 1.25x, maximum debt/EBITDA of 3.0x, and monthly borrowing base reporting.

Using the data below, build a complete FY2026 budget model covering: (1) monthly revenue recognition driven by the project pipeline and Colorado seasonality curve, (2) direct cost schedule — labor at $7.09M base with 5.5% escalation, materials with 2.8% inflation, subcontractors, and equipment at $382.8K/year, (3) G&A of $4.05M with mid-year PM hiring, (4) monthly cash flow with DSO of 58 days and DPO of 42 days, (5) debt service including $45.95K/month P&I plus LOC draws at 7.75%, (6) $733K CapEx plan, and (7) a KPI dashboard tracking gross margin vs. 18.5% target, EBITDA margin, DSCR, and DSO. Validate all outputs against FY2023–2025 historical trends. Target gross margin: 18.5%. Effective tax rate: 24.5%.

Present 3 distinct approaches to building this model with AI, differentiated by methodology, tooling, and audience framing. For each approach, describe the AI prompting strategy, the Excel/output structure, and the key risks or validation steps.
Time-box this step
One team asked Claude for three different ways to get the best prompt. The process was slow and they only completed that first stage, then used Claude inside Excel to build the financial statements. Another team recorded the opposite lesson: Claude recommended the more rigorous approach, they chose the light one, and they needed an audit pass afterwards (see section 06). 45:3055:30
05
Build prompts
Only a few build prompts appear on screen, because the breakout rooms are not in the recording. This section sets out the ones that do, plus the follow-up moves teams described aloud.
Anatomy of the master prompt
Claude’s master prompt (above) is a good template, because every part has a job.
Part
In the example
Why it helps
Role
“acting as Daniel Vega, Fractional CFO at Vega CFO Partners”
“Validate all outputs against FY2023–2025 historical trends”
Mirrors README instruction 4.
Targets
Gross margin 18.5%, effective tax rate 24.5%
Gives the AI something to test results against.
A plain-language prompt typed into Excel Copilot
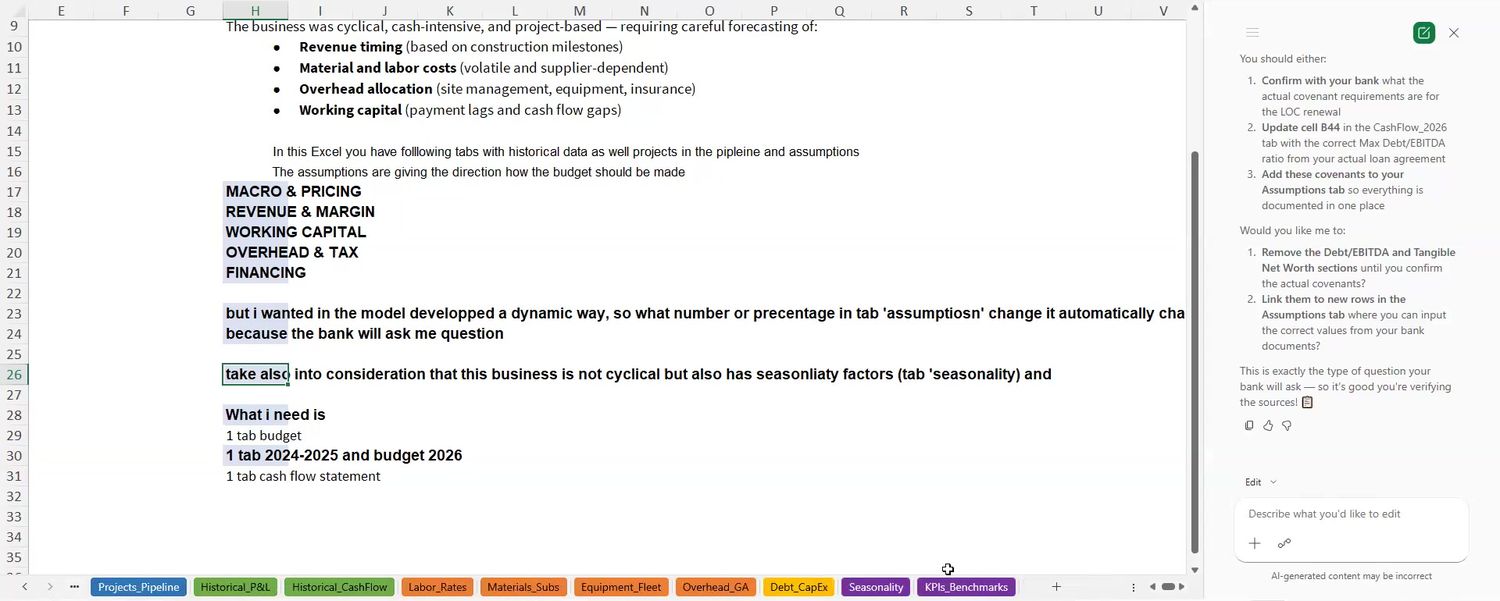
A second team skipped the master-prompt step and wrote straight into Microsoft Copilot inside the workbook. The original had typos, which the host and presenter noted do not matter because the AI reads through them. This version is lightly cleaned up. 40:30
Prompt on a sheet. The team wrote the brief in cells, then pointed Copilot at it. 41:15
Prompt · Excel Copilot, cleaned up from the screen
I need a budget for 2026. It is urgently needed for bank approval.

The business specifics: construction company. The business is cyclical, cash-intensive and project-based, requiring careful forecasting of:
• Revenue timing (based on construction milestones)
• Material and labor costs (volatile and supplier-dependent)
• Overhead allocation (site management, equipment, insurance)
• Working capital (payment lags and cash flow gaps)

In this Excel you have tabs with historical data, the projects in the pipeline, and assumptions. The assumptions give the direction for how the budget should be made:
MACRO & PRICING
REVENUE & MARGIN
WORKING CAPITAL
OVERHEAD & TAX
FINANCING

I want the model developed in a dynamic way: when a number or percentage in the 'Assumptions' tab changes, the budget changes automatically, because the bank will ask me questions.

Also take into consideration that this business is cyclical but also has seasonality factors (tab 'Seasonality').

What I need is:
1 tab budget
1 tab 2024-2025 and budget 2026
1 tab cash flow statement
Three things in this prompt are worth copying: the audience is stated (bank approval), the model has to be dynamic and tied to the Assumptions tab, and the required tabs are listed.
Follow-up moves seen in the session
Quoted wording is from the screen. Where a move was only described aloud, it is marked as a paraphrase.
Move
Wording
Team
Ask for the talk track
“Prepare for me a 2-3 minutes presentation with 2026 budget to be presented” 35:00
A
Convert a model to a dashboard
Paraphrase: make an HTML file from the budget, cash flow and historical budget tabs, then “more dynamic, like a dashboard” 44:00
B
Make the AI state its assumptions
Paraphrase: use reasonable and supportable assumptions; validate the data; make assumptions to complete it 49:00
D
Fill a known gap
Paraphrase: ask whether there is enough data to produce a balance sheet, then have it build one with stated assumptions 49:00
D
Fix the source of truth
Paraphrase: reconcile the data, and treat the Excel as the master source for the numbers, because Claude can generate separate figures for PowerPoint 52:30
E
Score the data
Paraphrase: run the data through a trust score, then audit and re-run 56:00
F
Save outputs into the project folder
“save the interactive dashboard as an HTML in the folder” 60:30
G
Not covered
Participants mentioned a CSI and FBI framework in the chat. The recording does not define it, so it is not described here. The host also promised to send a best-practice prompt after the session, and asked teams to post their own prompts in the community archive. Neither is in this recording.
06
Seven teams, seven answers
Every team started from the same files, and their FY2026 revenue ranged from $27.5M to $42.1M. The chart shows the base case each team put on screen. The numbers are not directly comparable, because teams chose different scenarios, treatments of the pipeline and levels of audit, and the session did not rank them.
Two teams (A and B) built on the probability-weighted pipeline and landed at $40.3M and $42.1M. Team F’s audit log flagged a $42M projection, up 68% on the prior year, as failing lender credibility, and rebased to contracted work only. The host’s own build sat at $32.5M and described itself as 95% supported by contracted work. Which pipeline number you build on explains much of the spread, so say which one you used.
Team
Tool and route
Output
Revenue
DSCR
Host
Claude, about 5 minutes of prompting
Six-tab mini-app (artifact)
$32.5M
4.04x
A
Claude: master prompt, then option 3
Interactive dashboard with sliders, 7-slide deck
$40.3M
3.03x
B
Excel Copilot, then ChatGPT for HTML
3 linked Excel tabs, credit dashboard
$42.1M
3.86x
C
Claude add-in inside Excel
3 statements, 3 scenarios
$27.5M
4.09x
D
ChatGPT: prompt, then HTML dashboard
Base / upside / downside dashboard
$32.9M
2.15x
E
Claude, work split across the team
Excel model, 8-slide deck
$29.0M
3.64x
F
Claude, audit pass, re-run
HTML deck with a data trust score
$32M
not legible
G
Claude desktop app working in a project folder
Model, lender and internal dashboards, data memo
$28.8M
2.26x min
DSCR is each team’s base case as shown. Revenue figures were read from the screen, because the spoken numbers in the transcript are sometimes garbled (a net income of $525K, for example, was spoken as “5.2”).
The host’s build
Claude artifact · 22:30–25:00
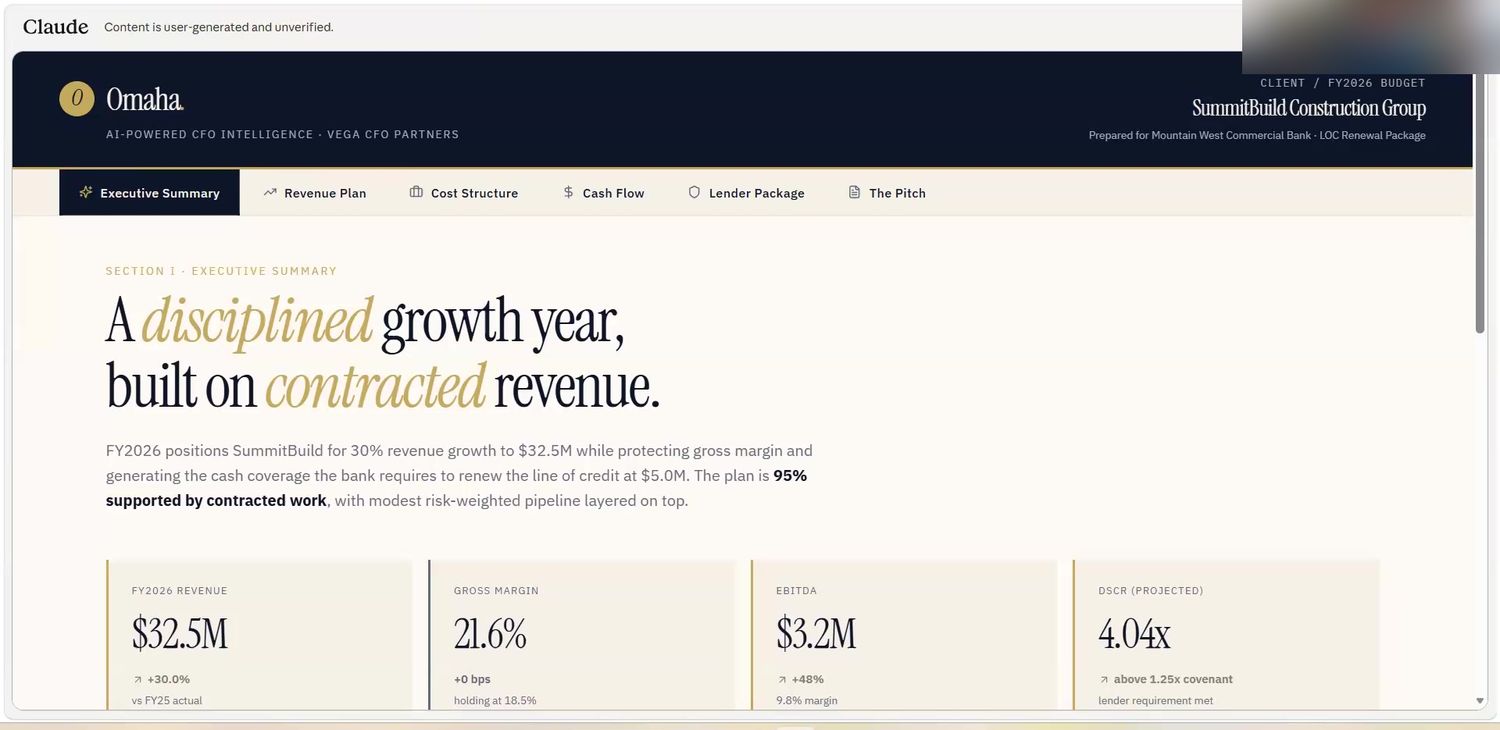
After the first breakout the host showed how he would approach the case: a Claude mini-app, or artifact, with tabs for the executive summary, revenue plan, cost structure, cash flow, lender package and the pitch. He said it took about five minutes of prompting. He teaches this build in week one of a six-week program, which then moves through financial analysis, custom GPTs and agents, and Python written by AI.
When a participant asked whether he had audited the data, he answered with the session’s standing advice: flag what you find in the presentation and say what you would confirm with the client. 24:45
The gross margin tile reads 21.6%, and its caption says “holding at 18.5%”. 18.5% is the target margin in the data. The recording does not explain the gap, and it is the kind of mismatch the audit step in section 07 exists to catch.
Team A
Claude, interactive dashboard · 31:30–36:30
Route
Uploaded both files to Claude, got the master prompt and three approaches, chose the interactive dashboard, then asked for a short presentation.
Output
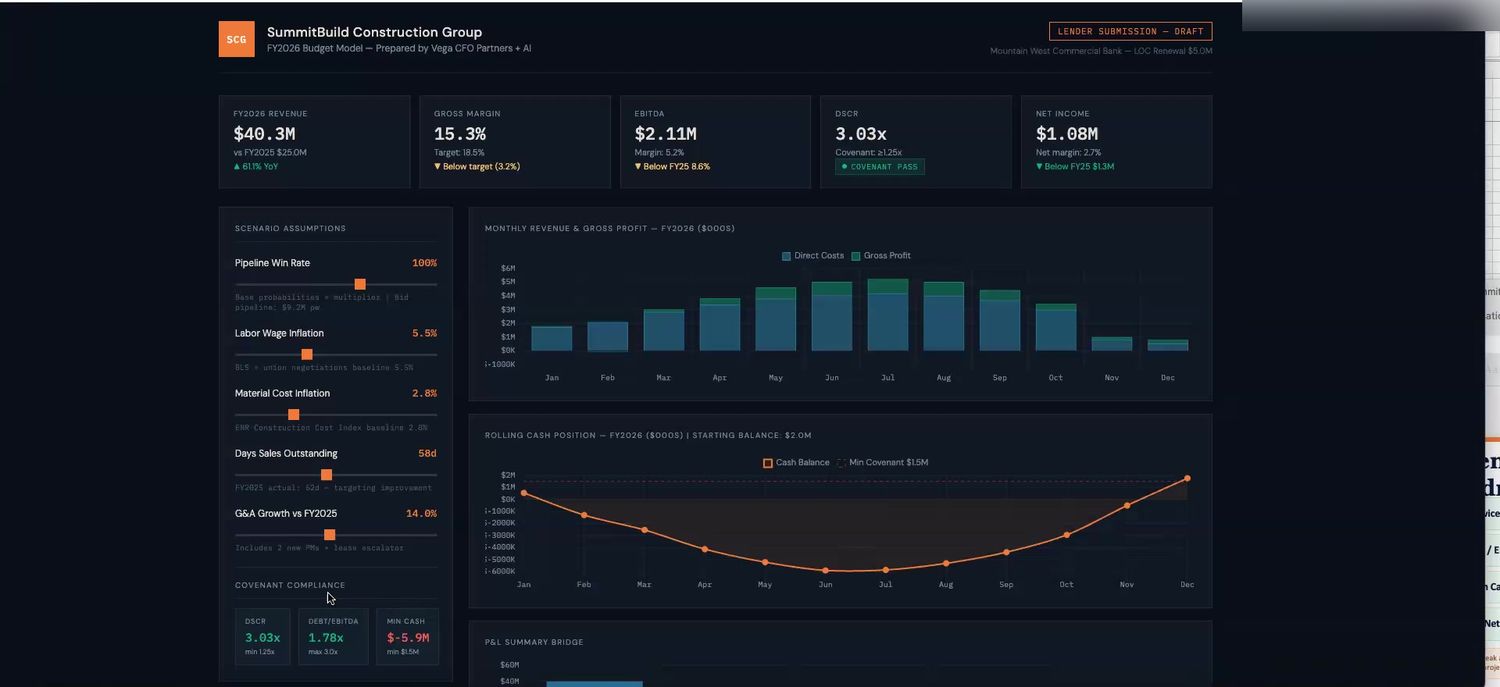
An HTML dashboard with sliders for pipeline win rate, labor wage inflation, material cost inflation, days sales outstanding and G&A growth, plus covenant tiles. Then a seven-slide lender deck covering the pipeline, P&L, covenant compliance and the “AI advantage”.
Headline
Revenue $40.3M, gross margin 15.3%, EBITDA $2.11M, DSCR 3.03x, net income $1.08M.
What they flagged
The default 100% pipeline win rate is unrealistic, and a union negotiation baseline of 5.5% matters because a strike would stop production. The data had a historical P&L and cash flow but no balance sheet, so only days sales outstanding could be flexed on the cash side.
Lesson
The presenter was candid that the team had not checked data integrity. The dashboard looked impressive, but how much you trust it depends on how much time went into checking the inputs.
Sliders. Pipeline win rate sits at 100%. 32:40
Team B
Excel Copilot, then ChatGPT · 39:00–46:00
Route
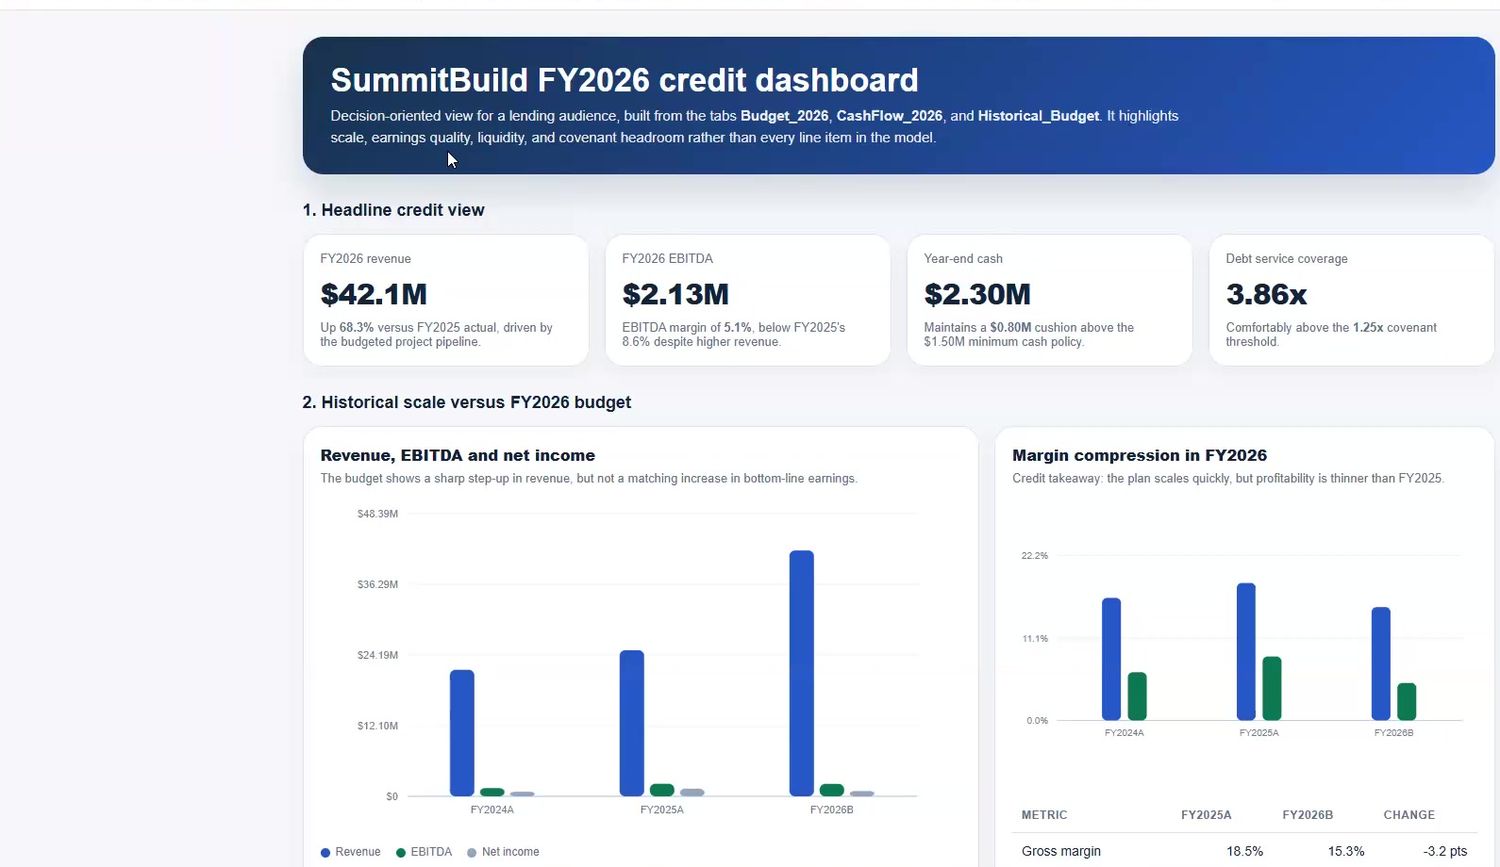
Wrote the brief in the workbook and let Copilot build the model in place. The team used ChatGPT for the HTML step because the presenter did not have Copilot on his own computer. It converted the tabs to HTML, first as a static page and then as a dashboard.
Output
Three tabs: a monthly 2026 budget from revenue to net income with percentage columns, a FY2024 and FY2025 versus FY2026 comparison with percentage and absolute variances, and a monthly cash flow with a covenant compliance summary. Formulas link to the Assumptions tab, so changing days payable outstanding, for example, updates the budget and cash flow.
Headline
Revenue $42.1M (up 68.3% on FY2025), EBITDA $2.13M, year-end cash $2.30M, DSCR 3.86x, with cash negative in some months.
What they flagged
Copilot reported what it could not find: the 3.0x debt/EBITDA covenant and a $3.5M minimum tangible net worth were not in the workbook, and it had assumed typical bank terms. It advised confirming them with the bank and adding them to the Assumptions tab.
Lesson
Ask the AI what it assumed. Copilot’s “What I did NOT find” list is the same flag the case asks you to raise with the client.
What I did NOT find. Copilot separates sourced covenants from assumed ones. 43:30
Credit dashboard. Built by ChatGPT from the Excel tabs. 45:00
Team C
Claude inside Excel · 45:30–48:30
Route
Asked Claude for three different ways to produce the best prompt, which took most of the time. They then used Claude as an Excel add-in to build the statements.
Output
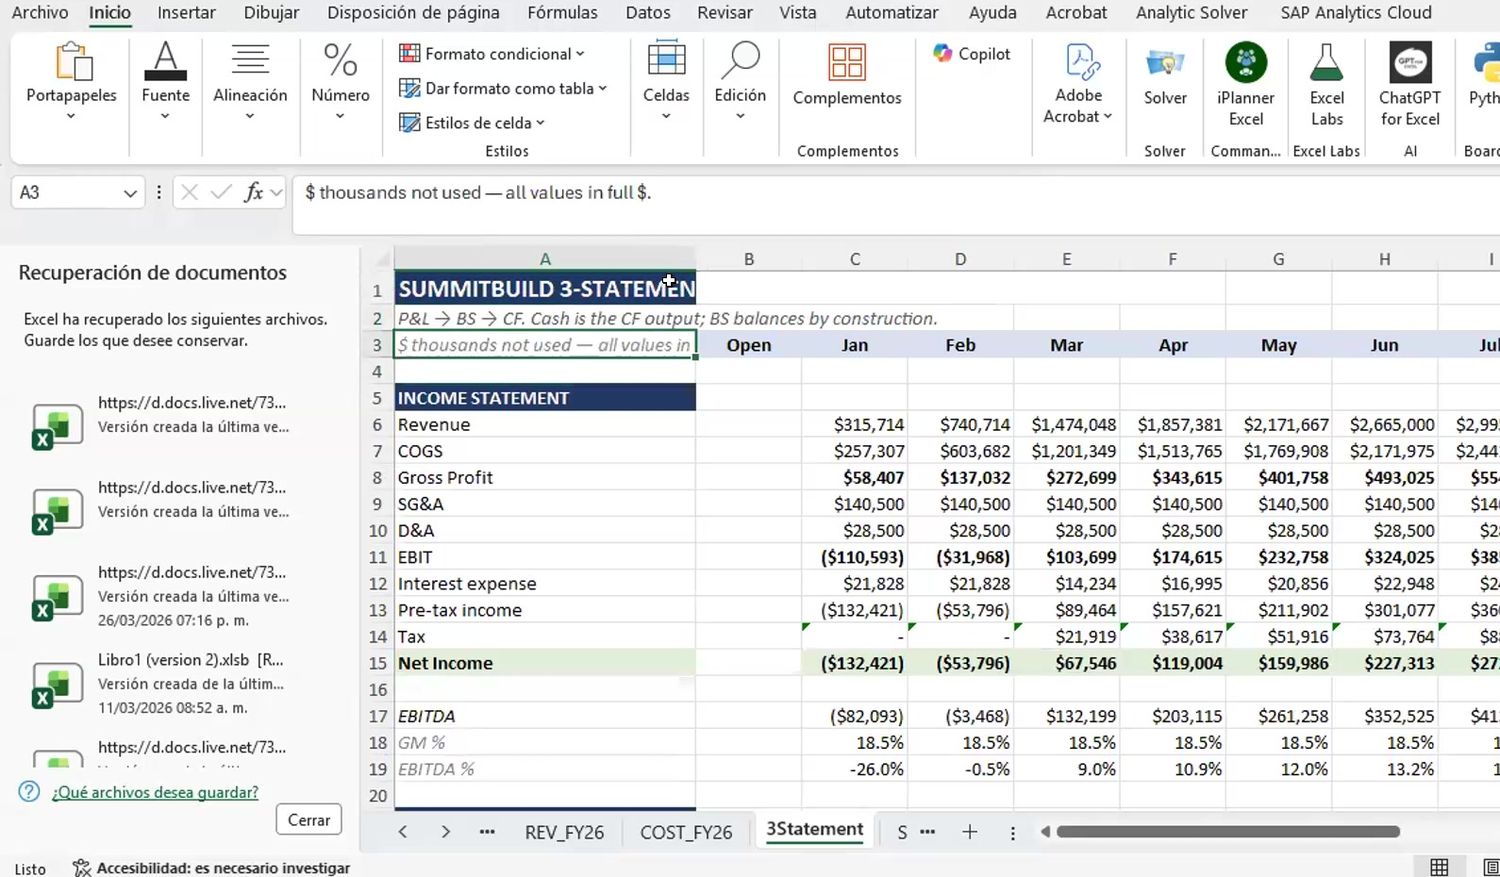
Monthly income statement, balance sheet and indirect-method cash flow statement, with a scenarios sheet (backlog conversion at 100%, 85% and 110%) and a covenant block. They had no time for a deck.
Headline
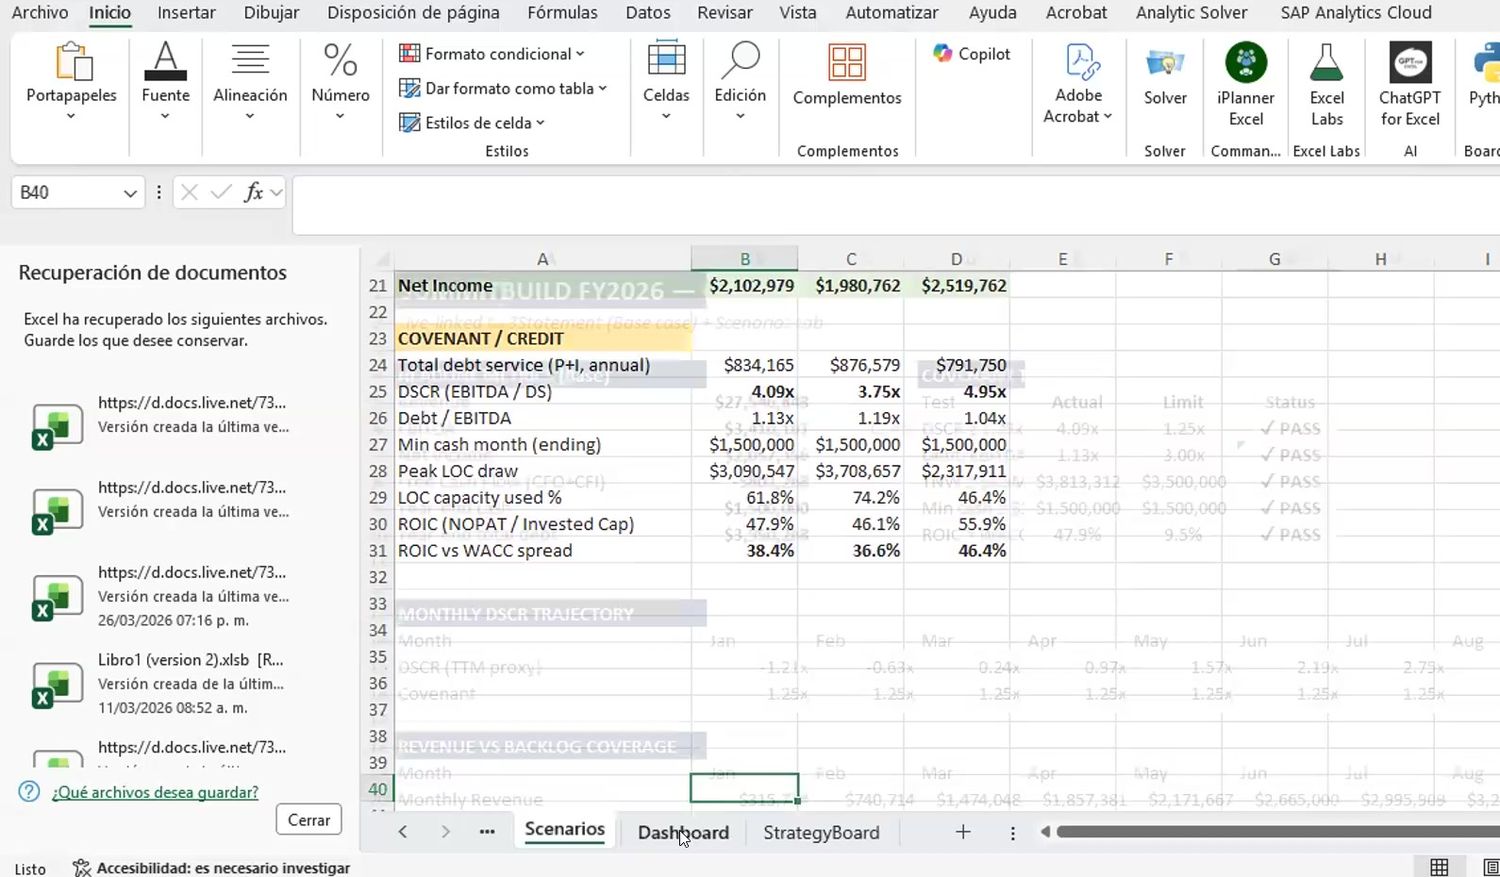
Base revenue $27.5M, EBITDA $3.41M, net income $2.10M, DSCR 4.09x (3.75x downside, 4.95x upside). Peak line-of-credit draw $3.09M in the base case. All three scenarios met the covenants.
Lesson
Time-box the prompt-writing step. This team did not run out of ideas, they ran out of time.
Three statements. Linked P&L, balance sheet and cash flow. 47:15
Scenarios. Covenant rows for each case. 48:30
Team D
ChatGPT, scenario dashboard · 49:00–52:00
Route
Attached the workbook and the case document, asked ChatGPT to write the prompt, and asked it for reasonable and supportable assumptions. They told it to validate the data and fill gaps, spotted that no balance sheet existed, and asked whether it had enough data to produce one.
Output
An HTML dashboard with a Base, Upside and Downside selector and tabs for the dashboard, assumptions and reasoning, and data quality and caveats. A framing panel states what the model is good for today and what is not yet final, including that a lender-ready version still needs a 31 December 2025 balance sheet.
Base case
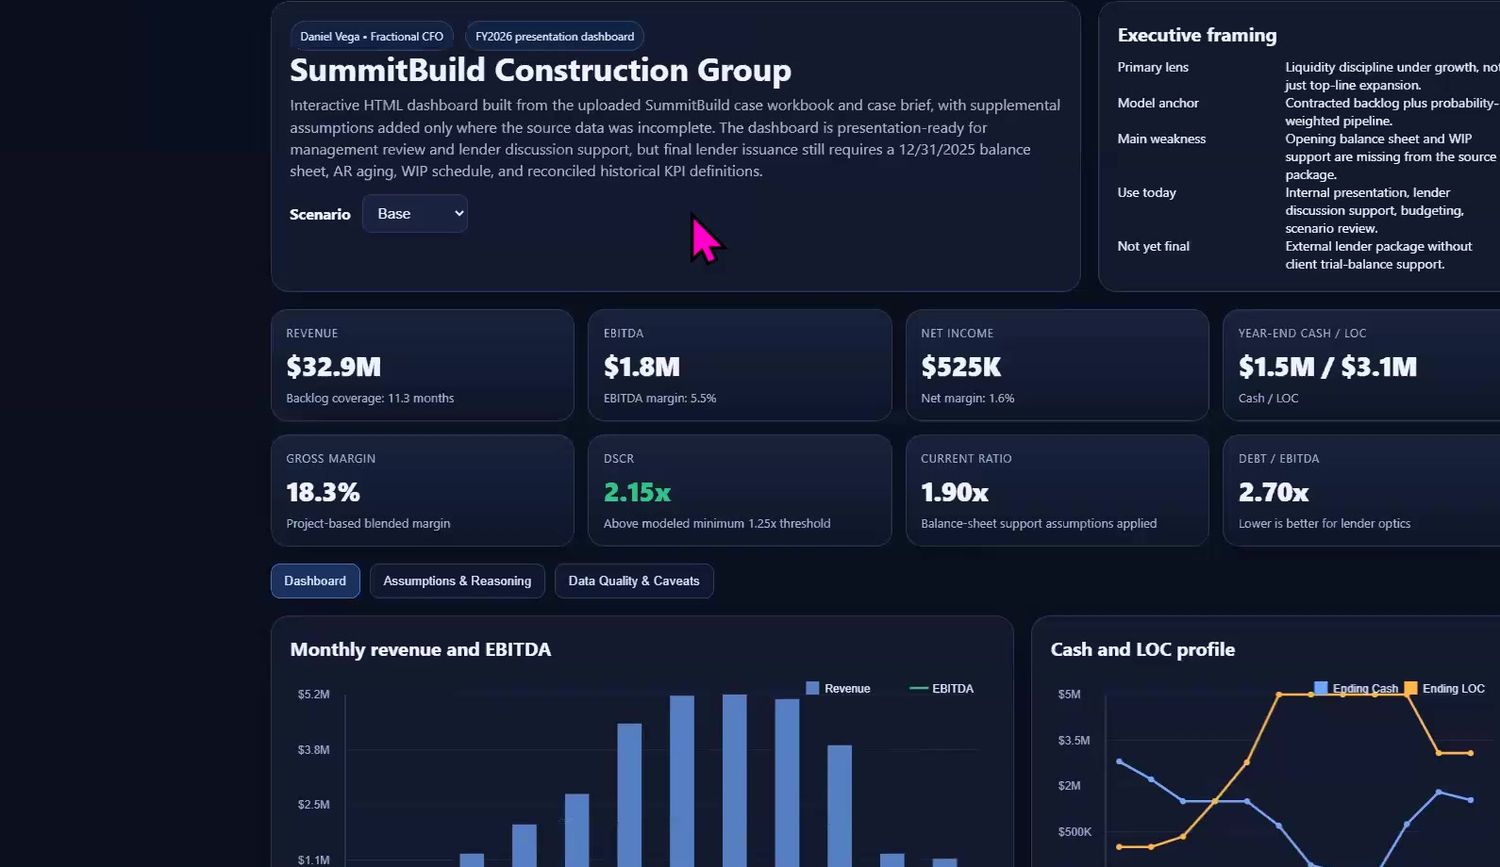
Revenue $32.9M, EBITDA $1.8M, net income $525K, gross margin 18.3%, DSCR 2.15x, debt/EBITDA 2.70x. Year-end cash $1.5M against a $3.1M line of credit.
Downside
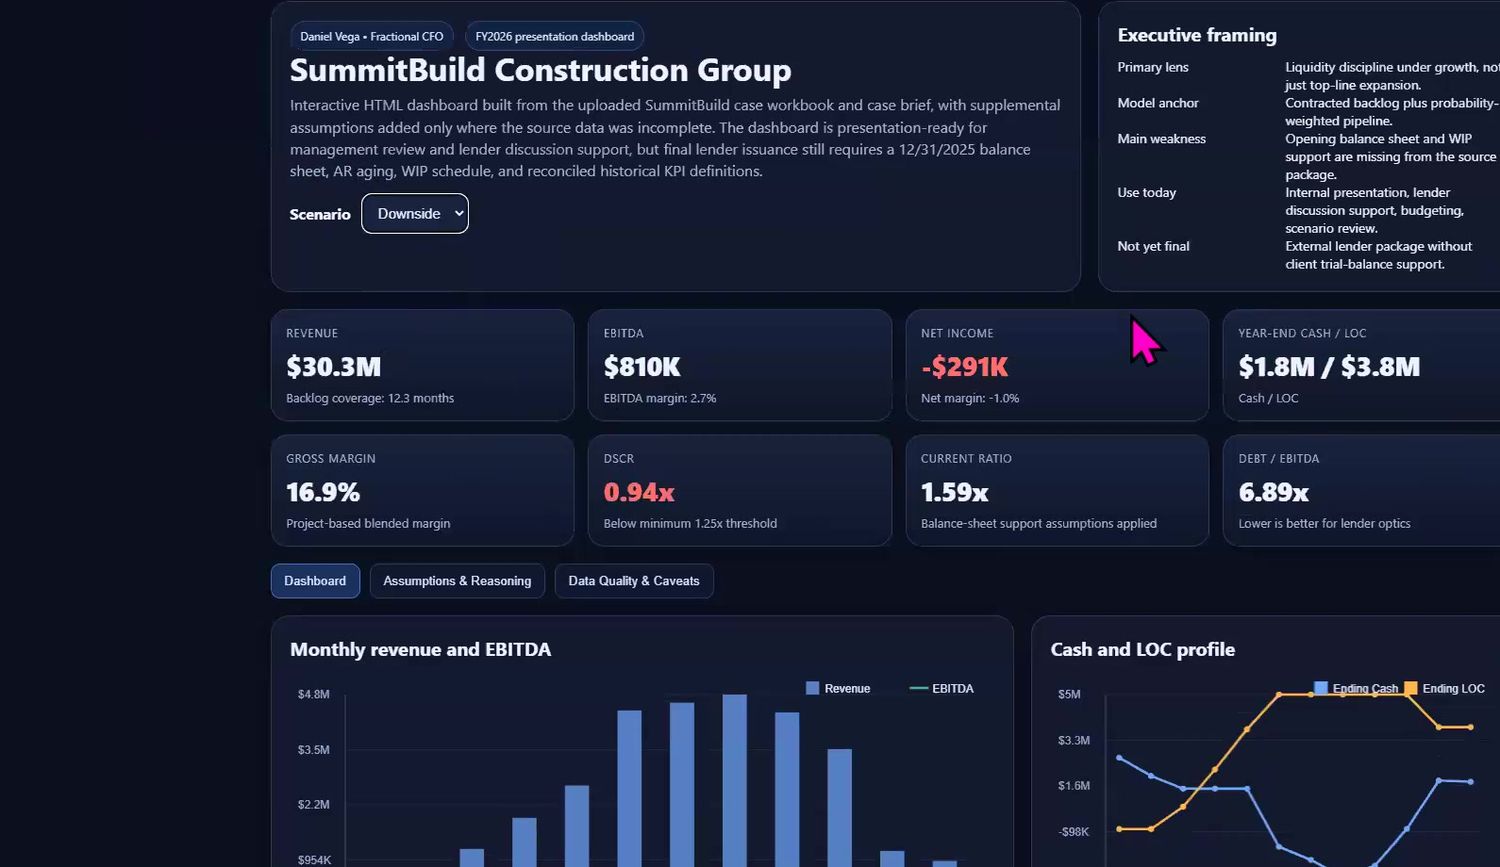
Revenue $30.3M, EBITDA $810K, net income −$291K, DSCR 0.94x (below the 1.25x covenant), debt/EBITDA 6.89x.
Lesson
A scenario toggle makes the covenant risk visible in seconds. Operating cash flow was negative in many months and the line of credit carried the gap.
Base. DSCR 2.15x, above the 1.25x covenant. 49:30
Downside. DSCR 0.94x, below the covenant. 51:45
Team E
Claude, divide and conquer · 52:30–55:00
Route
One teammate ran data integrity, consistency and missing-data checks and cleaned the file, though there was no time to feed it back into the model. The builder told Claude to reconcile the data and treat the Excel as the master source, because Claude can produce separate numbers for the deck.
Output
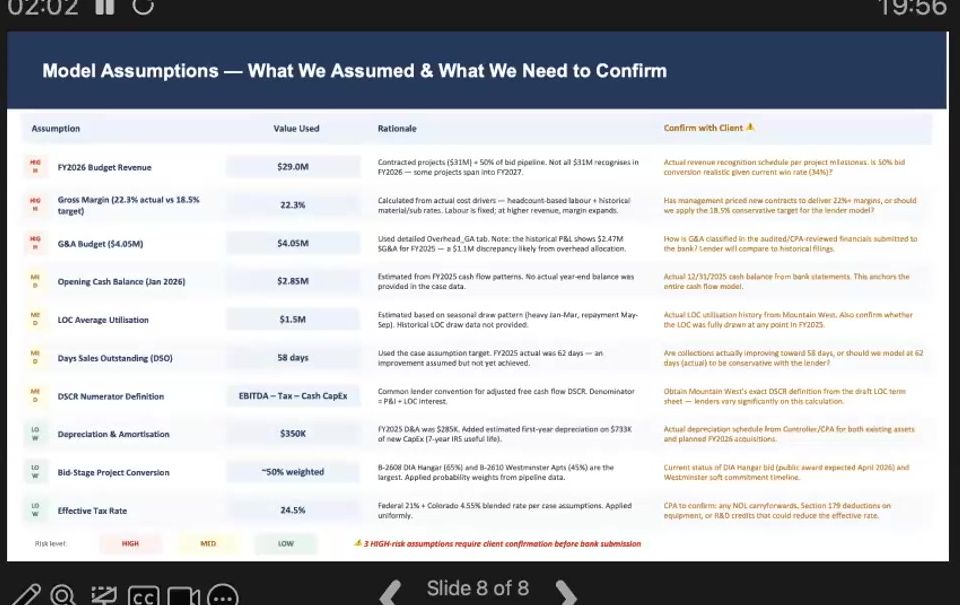
An Excel model and an eight-slide deck: title KPIs, revenue forecast, cash flow and liquidity, lender readiness, and a closing slide titled “Model Assumptions — What We Assumed & What We Need to Confirm”.
Headline
Revenue $29.0M, EBITDA $2.4M, DSCR 3.64x, $5M line of credit request.
Open issues
The cash flow totals did not agree to the Excel sheet. Another revenue figure of about $30M to $31M was also in circulation, an assumption on revenue recognition that they listed to check with the client.
Lesson
Splitting the work this way produced both the model and the audit. The assumptions slide is a ready-made pattern for the flags the README requires.
Title slide. Four numbers a banker looks for first. 53:00
Assumptions slide. What was assumed, and what to confirm. 55:00
Team F
Claude, audit then re-run · 55:30–58:30
Route
Asked for three options. Claude recommended the rigorous one, and the team picked the light and easy one. They did not like the first result, so they went back, audited the data, re-ran, and turned the output into an HTML summary deck. The presenter described himself as a beginner and said the group effort was mostly in writing the prompts.
Output
An HTML deck that includes a data trust score and a list of the critical issues Claude found and fixed. Cash went negative in some months but recovered by year end.
Headline
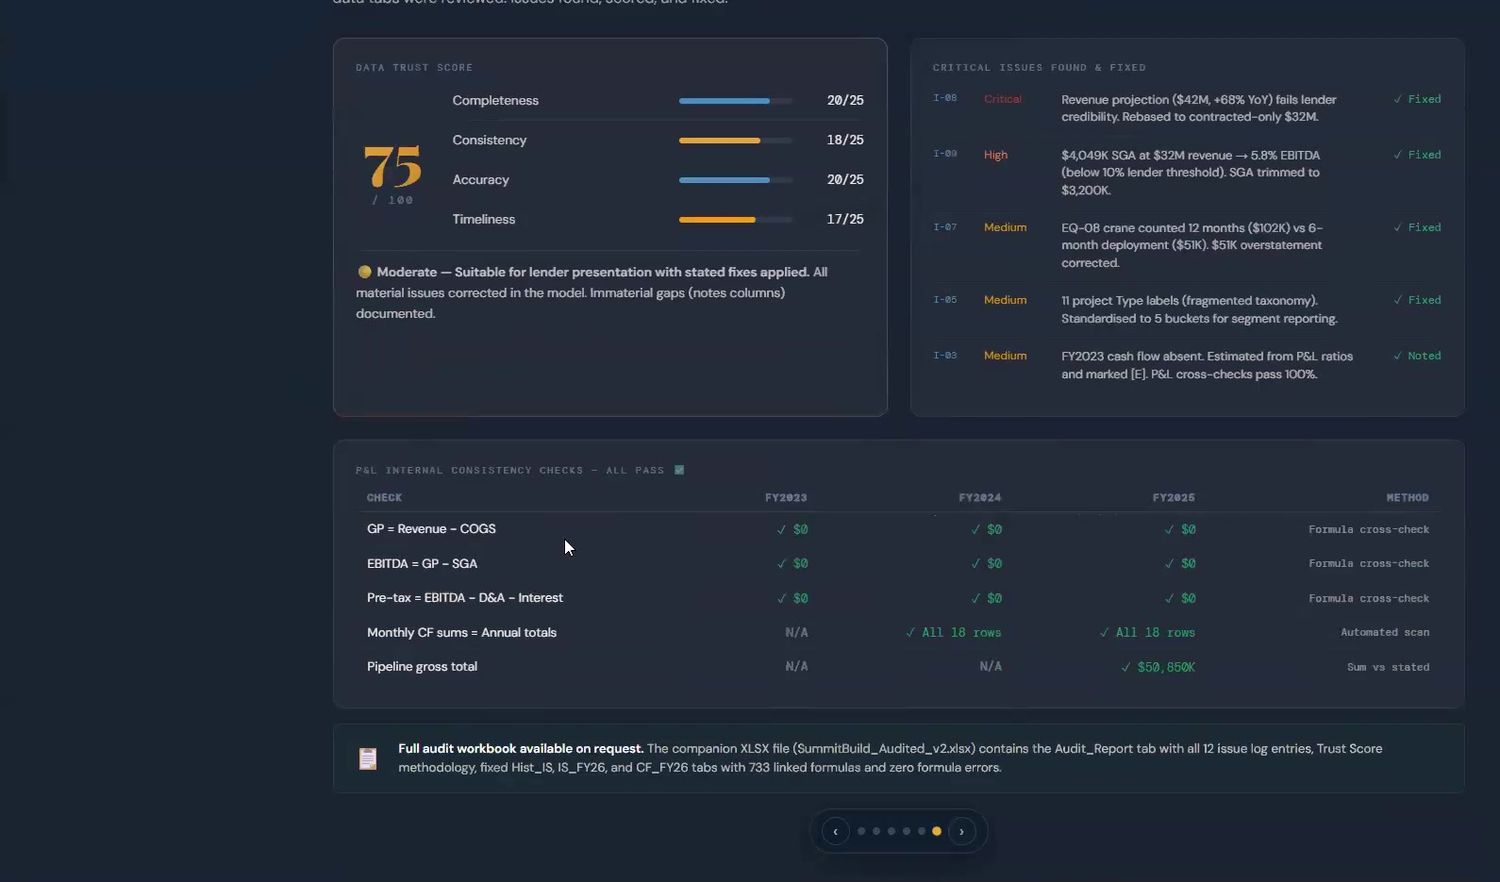
Revenue $32M, rebased to contracted work only. Trust score 75 out of 100: “Moderate — suitable for lender presentation with stated fixes applied”.
Lesson
Making the AI expose what it found in the dirty data was more convincing than a polished chart. The issue log is covered in section 07.
Data trust score. Four sub-scores, five of the twelve logged issues, and the consistency checks that passed. 56:30
Team G
Claude desktop app (Cowork), project folder · 58:30–61:00
Route
Put the source files in one folder and had Claude reference them there, so every output landed in the same place. The presenter had not read all the outputs yet, and some HTML formatting was off.
Output
An Excel model, an internal CFO dashboard, a data-integrity report with an architecture plan, and a separate credit-strength dashboard written as a lender view. The lender and internal views were kept apart on purpose.
Headline
Revenue about $28.8M (+15% on the prior year), minimum DSCR 2.26x against the 1.25x covenant.
Lesson
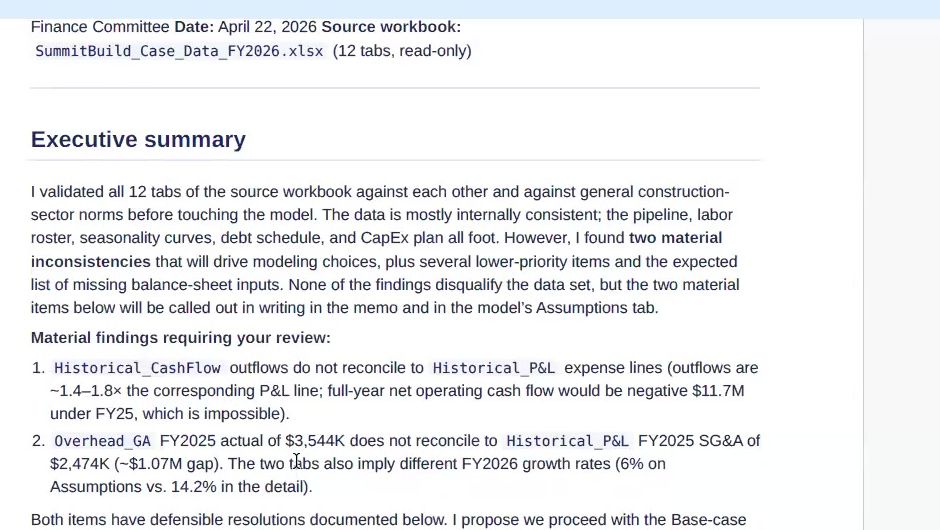
The integrity memo reported two material inconsistencies (below) before the model was touched.
07
Audit the data
Before the second breakout the host advised teams to flag discrepancies between tabs, and a participant said their team had already found several. The recording shows what some teams’ AI tools reported. This guide did not have the workbook, so none of these findings has been re-derived. Treat them as leads to check, and confirm each against the source before you quote it.
Data-integrity memo. Written by Claude for Team G before it built the model. 60:00
Finding
Reported by
How it was handled
Historical_CashFlow outflows do not reconcile to Historical_P&L expense lines. They run about 1.4 to 1.8 times the P&L line, which would make FY25 net operating cash flow negative $11.7M.
G
Called out in the memo and the Assumptions tab; a resolution was proposed.
Overhead_GA FY2025 actual of $3,544K does not reconcile to Historical_P&L FY2025 SG&A of $2,474K, a gap of about $1.07M. The two tabs also imply different FY2026 growth rates (6% on Assumptions, 14.2% in the detail).
G
Same: flagged in writing and proposed a base-case treatment.
Revenue projection of $42M (+68% year on year) fails lender credibility.
F
Rebased to contracted-only $32M.
$4,049K SG&A at $32M revenue gives a 5.8% EBITDA margin, below a 10% lender threshold.
F
SG&A trimmed to $3,200K.
A crane counted for 12 months ($102K) against a 6-month deployment ($51K), a $51K overstatement.
F
Corrected.
Eleven project type labels, a fragmented taxonomy.
F
Standardized to five buckets.
FY2023 cash flow is absent.
F
Estimated from P&L ratios and marked as an estimate.
Max debt/EBITDA of 3.0x and a $3.5M minimum tangible net worth are not stated in the workbook.
B
Assumed typical bank terms and recommended confirming with the bank.
No balance sheet in the data.
A, D, G
D asked the AI to build one with stated assumptions. A flexed only days sales outstanding. G listed the missing inputs.
Pipeline win rate defaults to 100%.
A
Called unrealistic; left adjustable by slider.
Cash flow totals do not agree to the Excel sheet; a second revenue figure of about $30M to $31M.
E
Listed as items to confirm with the client.
A repeatable audit sequence
The order below is this guide’s synthesis of what the teams did. It is not a framework the host taught.
Check each tab against itself. Do seasonality curves sum to 100%? Does gross profit equal revenue minus cost of sales, and EBITDA equal gross profit minus SG&A? Do monthly cash flows sum to the annual total? (Team G’s memo passed its seasonality checks, and Team F’s checks passed the P&L ties.)
Reconcile tabs against each other. Cash flow to P&L, overhead detail to SG&A, pipeline detail to the stated total ($50,850K gross in Team F’s check).
Test plausibility. A 68% growth year, or an EBITDA margin below the lender’s threshold, is a credibility problem even when the arithmetic is right.
List what is missing. A balance sheet, a work-in-progress schedule, prior-year cash flow, covenant definitions.
Standardize and log. Merge inconsistent labels, then record each issue with a severity and what you did about it.
Score or summarize. Team F’s trust score broke 75 out of 100 into Completeness 20/25, Consistency 18/25, Accuracy 20/25 and Timeliness 17/25.
Editor’s note
Several of Team F’s “fixes” change the client’s numbers, for example cutting SG&A from $4,049K to $3,200K so that EBITDA clears a threshold. By the session’s own rule, an adjustment like that is an assumption made on the client’s behalf. It belongs on the slide that says what you would confirm with them.
08
Present in two minutes
The host asked for presentations under two minutes, and the room saw seven in about 30 minutes. What the presenters showed fell into a few patterns.
A result a banker can read. Revenue, EBITDA, DSCR against the 1.25x covenant and the amount of credit requested (Team E’s title slide).
A downside case. Team D’s toggle showed DSCR falling to 0.94x, and Team C’s scenarios showed the model holding in all three cases.
Data quality, stated openly. Teams F and G led with what they found, and Team A said plainly that it had not checked.
Assumptions and open questions. Team E’s closing slide listed what was assumed and what to confirm.
Two audiences. Team G kept a lender view apart from an internal CFO view.
A two-minute running order
This order is a suggestion that combines those patterns. It is not a template from the session.
Seconds
Say
0–15
The ask and the headline: what the client needs and what the plan delivers (revenue, EBITDA).
15–45
The covenant test: DSCR and debt/EBITDA against the bank’s limits, base case.
45–70
The downside: what breaks first, and by how much.
70–100
What you found in the data, and what you changed because of it.
100–120
Assumptions you made on the client’s behalf, and the questions you would take back to them.
09
Checklist and open items
Before you present
Open items from the session
The host said he would prepare a best-practice prompt and share it. It is not in this recording.
Participants were invited to post their prompts and outputs in the community archive, and teams that did not present could record a short video.
The breakout rooms, where most prompting happened, were not recorded.